

10 mejores alternativas a Tableau para el análisis minorista en 2026

Selección de alternativas a Tableau


Una alternativa sólida a Tableau ofrece a tu equipo análisis flexibles, visualización de datos intuitiva e integración con tus fuentes de datos existentes, sin limitarte al ecosistema de un único proveedor. Si buscas las mejores alternativas a Tableau, probablemente estés valorando el coste, las opciones de implementación y hasta qué punto cada herramienta se adapta a tus flujos de trabajo de análisis.
Esta lista te ayudará a comparar las principales opciones para que puedas elegir con confianza una solución que se ajuste a las necesidades de informes de tu empresa, a tus requisitos técnicos y a tus planes de crecimiento.
¿Qué es Tableau?
Tableau es un software de análisis que te permite visualizar, analizar y compartir datos mediante paneles e informes interactivos. Los equipos utilizan Tableau para conectarse a varias fuentes de datos, explorar tendencias y presentar información en un formato visual.
Su interfaz de arrastrar y soltar y su amplia variedad de integraciones lo convierten en una opción popular para la inteligencia empresarial, la generación de informes y la toma de decisiones basada en datos en el comercio minorista, el comercio electrónico y otros sectores.
Resumen de las mejores alternativas a Tableau
Este cuadro comparativo resume los detalles de precios de mis principales alternativas a Tableau para ayudarte a encontrar la mejor opción para tu presupuesto y las necesidades de tu empresa.
| Tool | Best For | Trial Info | Price | ||
|---|---|---|---|---|---|
| 1 | Ideal para realizar un seguimiento del comportamiento de los visitantes del sitio web | Plan gratuito disponible | Precios bajo solicitud | Website | |
| 2 | Ideal para el análisis de cohortes del uso del producto | Plan gratuito disponible | Precios bajo solicitud | Website | |
| 3 | Ideal para obtener información sobre embudos de comportamiento | Plan gratuito disponible | Precios bajo solicitud | Website | |
| 4 | Ideal para análisis integrados en aplicaciones | Prueba gratuita de 7 días + demo gratuita disponible | Precio bajo consulta | Website | |
| 5 | Ideal para la captura automática de datos de eventos | Plan gratuito + demostración gratuita disponible | Precio bajo consulta | Website | |
| 6 | Ideal para obtener información en tiempo real sobre aplicaciones móviles | Demostración gratuita disponible | Desde $40/mes | Website | |
| 7 | Ideal para obtener flexibilidad en la implementación autohospedada | Plan gratuito disponible | Desde $0.00005/evento | Website | |
| 8 | Ideal para informes centrados en la privacidad | Prueba gratuita de 21 días + demostración gratuita disponible | Desde $26/mes | Website | |
| 9 | Ideal para la integración con el ecosistema de Microsoft 365 | Plan gratuito disponible | Desde $14/usuario/mes (facturado anualmente) | Website | |
| 10 | Ideal para crear paneles personalizables | Prueba gratuita disponible | Precios bajo solicitud | Website |
Por qué confiar en nuestras recomendaciones de software
Nuestro equipo lleva probando y evaluando software desde 2012. Como líderes del sector retail, sabemos lo difícil —y lo importante— que es elegir el software adecuado.
Para esta guía, evaluamos las herramientas mediante pruebas prácticas e investigación independiente, puntuando las herramientas según nuestros criterios de selección.
Nuestras reseñas reflejan nuestro criterio independiente, no un discurso de ventas.
Análisis de alternativas a Tableau
A continuación encontrarás mis resúmenes detallados de las alternativas a Tableau que han entrado en mi selección. Mis análisis ofrecen una visión detallada de las funciones, los casos de uso más adecuados y las integraciones de cada plataforma para ayudarte a encontrar la mejor opción para tu empresa.
Ideal para realizar un seguimiento del comportamiento de los visitantes del sitio web
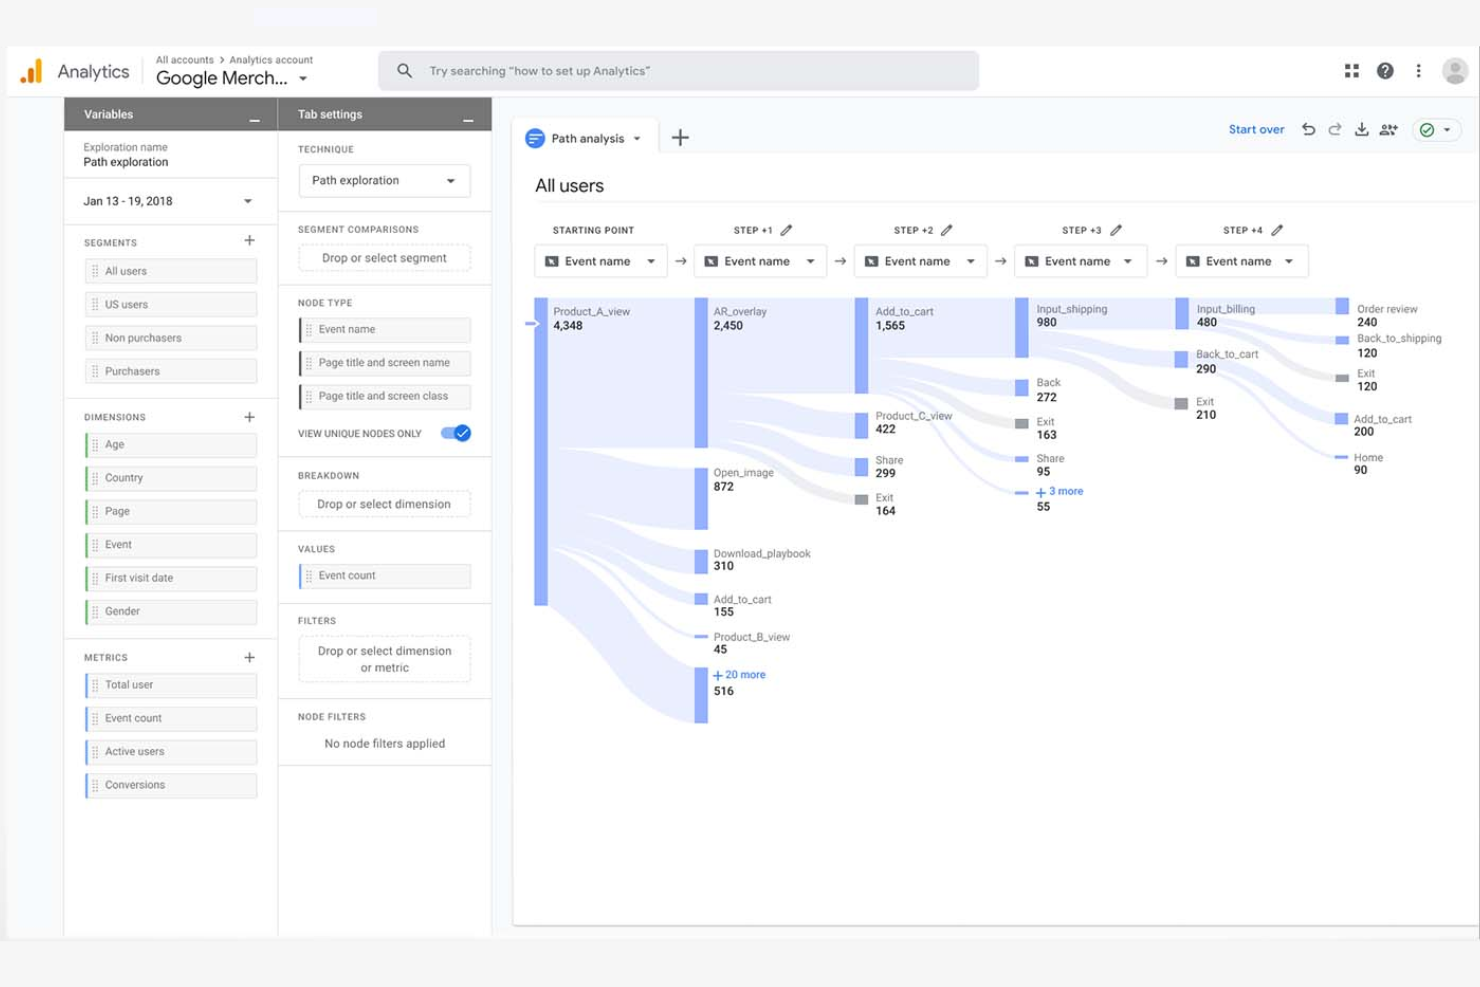
Si necesitas comprender exactamente cómo interactúan los visitantes con tu sitio web, Google Analytics ofrece herramientas detalladas de seguimiento y generación de informes diseñadas para equipos digitales. Es especialmente útil para equipos de comercio electrónico, marketing y contenido que desean analizar los recorridos de los usuarios, los embudos de conversión y el rendimiento de las campañas. A diferencia de Tableau, Google Analytics se especializa en la recopilación de datos web en tiempo real y la atribución, por lo que es una opción preferida para optimizar las experiencias en línea.
Por qué Google Analytics es una buena alternativa a Tableau
Para los equipos centrados en comprender el comportamiento de los visitantes del sitio web, Google Analytics ofrece herramientas especializadas que Tableau no proporciona de forma inmediata. Elegí Google Analytics porque realiza un seguimiento de la actividad de los usuarios en tiempo real, las páginas vistas y las fuentes de tráfico directamente desde tu sitio web. La plataforma también permite configurar objetivos de conversión y analizar los flujos de usuarios para identificar con precisión dónde los visitantes abandonan el sitio o realizan una conversión. Si tu principal prioridad es optimizar las experiencias digitales y las campañas, Google Analytics ofrece la información específica que necesitas.
Características principales de Google Analytics
Otras características de Google Analytics que pueden resultar valiosas para los equipos digitales incluyen:
- Seguimiento de eventos personalizados: Configura y supervisa acciones específicas de los usuarios, como descargas, reproducciones de vídeos o envíos de formularios.
- Segmentación de audiencias: Crea y analiza grupos de audiencia personalizados según datos demográficos, comportamiento o canal de adquisición.
- Informes de comercio electrónico: Realiza un seguimiento del rendimiento de los productos, los datos de las transacciones y las métricas de ingresos de las tiendas en línea.
- Integración con Data Studio: Conéctate con Google Data Studio para crear informes y visualizaciones personalizados utilizando tus datos analíticos.
Integraciones de Google Analytics
Las integraciones incluyen Google Ads, Google Tag Manager, Google Search Console, Google Data Studio, Google Optimize, Google AdSense, Firebase, BigQuery, Display & Video 360 y Search Ads 360.
Pros and Cons
Pros:
- Plataforma en la nube gratuita para analizar datos del sitio web y obtener información sobre el tráfico
- Segmentación de audiencias y seguimiento de embudos para medir el rendimiento del marketing
- Facilidad de uso para startups y pequeñas empresas que analizan el comportamiento web
Cons:
- Herramientas de inteligencia empresarial limitadas en comparación con las plataformas completas de inteligencia empresarial
- La configuración avanzada y la configuración de informes pueden requerir mucho tiempo

Mixpanel
Ideal para el análisis de cohortes del uso del producto

Para los equipos centrados en comprender cómo interactúan los usuarios con los productos digitales, Mixpanel ofrece una solución de analítica especializada. Es especialmente útil para responsables de producto, equipos de crecimiento y empresas SaaS que necesitan analizar cohortes de usuarios y realizar un seguimiento de la adopción de funcionalidades a lo largo del tiempo. A diferencia de Tableau, Mixpanel está diseñado para el seguimiento basado en eventos y facilita la segmentación de usuarios según sus patrones de comportamiento, retención y participación.
Por qué Mixpanel es una buena alternativa a Tableau
Mixpanel adopta un enfoque diferente al de Tableau al centrarse en el análisis de cohortes del uso del producto. Elegí Mixpanel para equipos que necesitan realizar un seguimiento de cómo interactúan distintos grupos de usuarios con las funcionalidades a lo largo del tiempo. Su seguimiento basado en eventos permite crear cohortes detalladas según las acciones de los usuarios, la retención y la participación. Mixpanel también ofrece análisis de embudos e informes de retención que ayudan a identificar con precisión dónde abandonan los usuarios o cuándo regresan, por lo que es una opción muy adecuada para los equipos de producto y crecimiento.
Principales funcionalidades de Mixpanel
Otras funcionalidades de Mixpanel que pueden interesar a quienes buscan una solución de analítica incluyen:
- Análisis de pruebas A/B: Mide y compara el impacto de los experimentos en el comportamiento de los usuarios.
- Paneles personalizados: Crea y comparte paneles adaptados a las métricas de tu equipo.
- Importación y exportación de datos: Incorpora datos de otras fuentes y exporta informes según sea necesario.
- Alertas y notificaciones: Configura alertas automatizadas para detectar cambios o anomalías en métricas clave.
Integraciones de Mixpanel
Las integraciones incluyen Segment, Snowflake, Google BigQuery, Salesforce, HubSpot, Slack, Zapier, Airflow y Fivetran.
Pros and Cons
Pros:
- Análisis de datos de comportamiento con información detallada sobre cohortes y retención
- Las herramientas de segmentación ayudan a los usuarios empresariales a analizar los patrones de participación
- Plataforma en la nube diseñada para startups y equipos de productos SaaS
Cons:
- No está diseñada para la elaboración general de informes de inteligencia empresarial
- Las consultas avanzadas pueden generar una curva de aprendizaje pronunciada

Ideal para obtener información sobre embudos de comportamiento
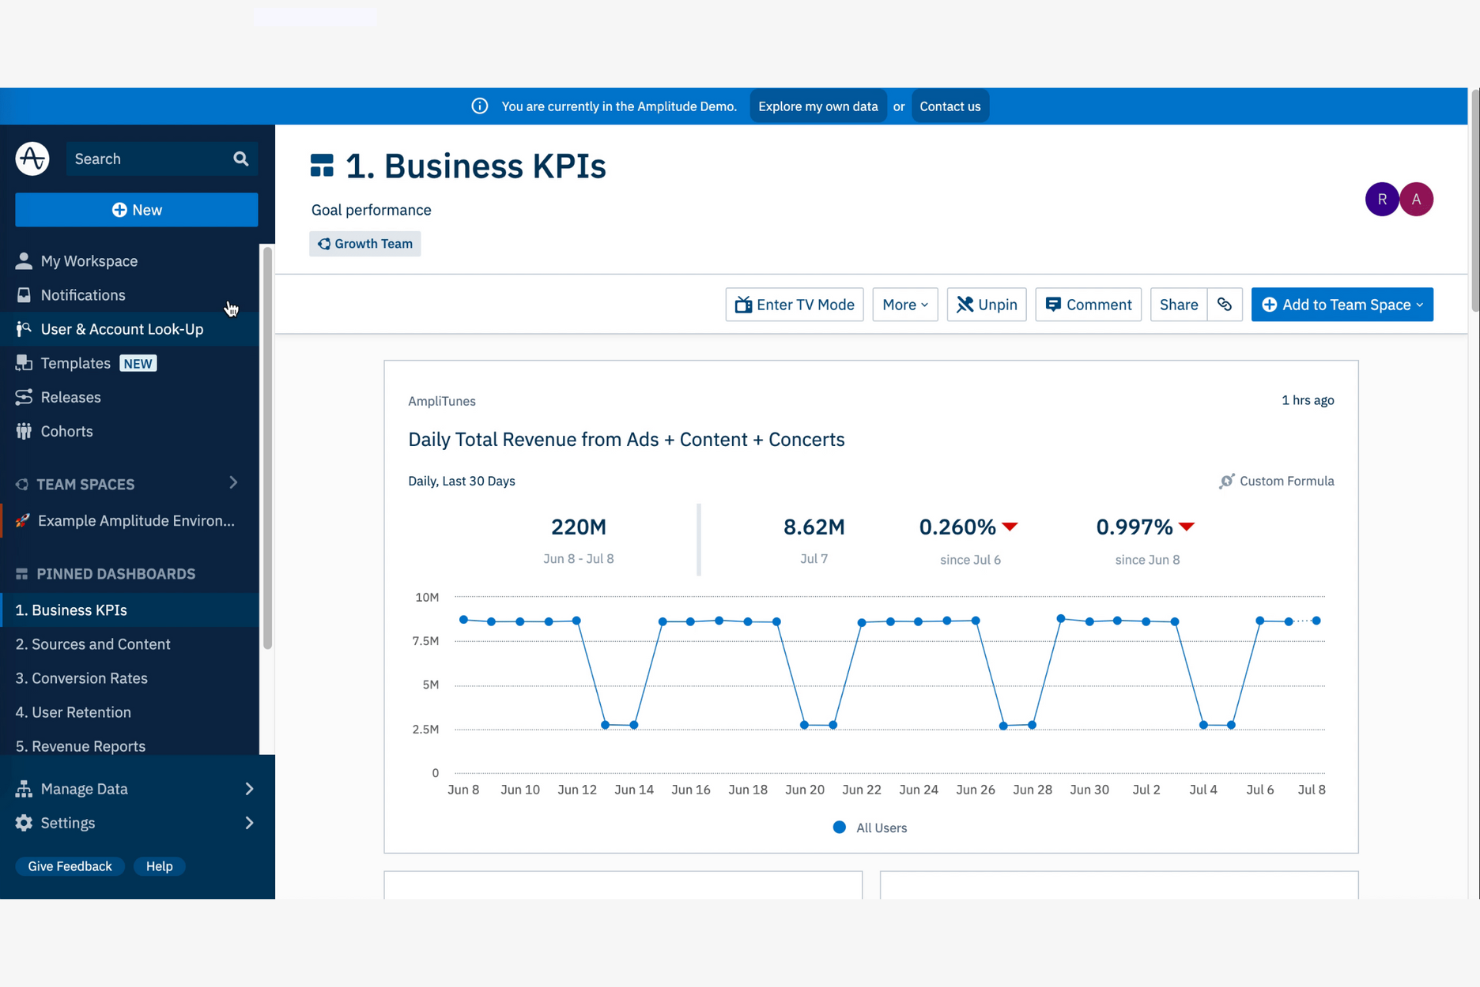
Si necesitas profundizar en cómo los usuarios se desplazan por tu producto digital, Amplitude está diseñado para ese propósito. Los gerentes de producto, los analistas de crecimiento y los equipos de comercio electrónico utilizan Amplitude para descubrir información detallada sobre los embudos de comportamiento que va más allá de los paneles estándar. A diferencia de Tableau, Amplitude se especializa en mapear los recorridos de los usuarios y señalar dónde abandonan o realizan conversiones dentro de flujos de trabajo específicos.
Por qué Amplitude es una buena alternativa a Tableau
Amplitude destaca para los equipos que necesitan analizar en detalle los embudos de comportamiento. Elegí Amplitude porque permite visualizar cada paso que dan los usuarios antes de realizar una conversión o abandonar, algo en lo que Tableau no se especializa. Con sus herramientas de análisis de embudos, puedes desglosar los recorridos de los usuarios, segmentarlos según su comportamiento e identificar puntos de fricción en tiempo real. Las funciones de análisis de rutas y retención de Amplitude también te ayudan a comprender cómo los cambios en tu producto afectan al flujo y la interacción de los usuarios.
Características principales de Amplitude
Algunas otras características de Amplitude que los compradores de soluciones de análisis pueden querer conocer incluyen:
- Segmentación de eventos: Analiza y compara las acciones de los usuarios en distintos segmentos y periodos.
- Paneles personalizados: Crea y comparte paneles adaptados a las métricas específicas de tu equipo.
- Herramientas de gobernanza de datos: Gestiona la calidad de los datos, la taxonomía y los controles de acceso dentro de la plataforma.
- Análisis predictivo: Utiliza modelos de aprendizaje automático para pronosticar el comportamiento y los resultados de los usuarios.
Integraciones de Amplitude
Las integraciones incluyen Twilio Segment, Braze, Amazon, HubSpot, Google Search Console, Google Ads, Hotjar, LaunchDarkly, Mailchimp, Marketo, Notion, Salesforce CRM y muchas más.
Pros and Cons
Pros:
- Análisis avanzado de datos de productos con información sobre embudos de comportamiento
- Análisis de autoservicio para usuarios empresariales que exploran los recorridos de los usuarios
- Plataforma en la nube escalable diseñada para empresas emergentes de alto crecimiento y equipos de SaaS
Cons:
- Las opciones de visualización son menos flexibles que las de las herramientas tradicionales de inteligencia empresarial
- Las funciones avanzadas pueden requerir una configuración técnica y una gestión continua
Sisense
Ideal para análisis integrados en aplicaciones
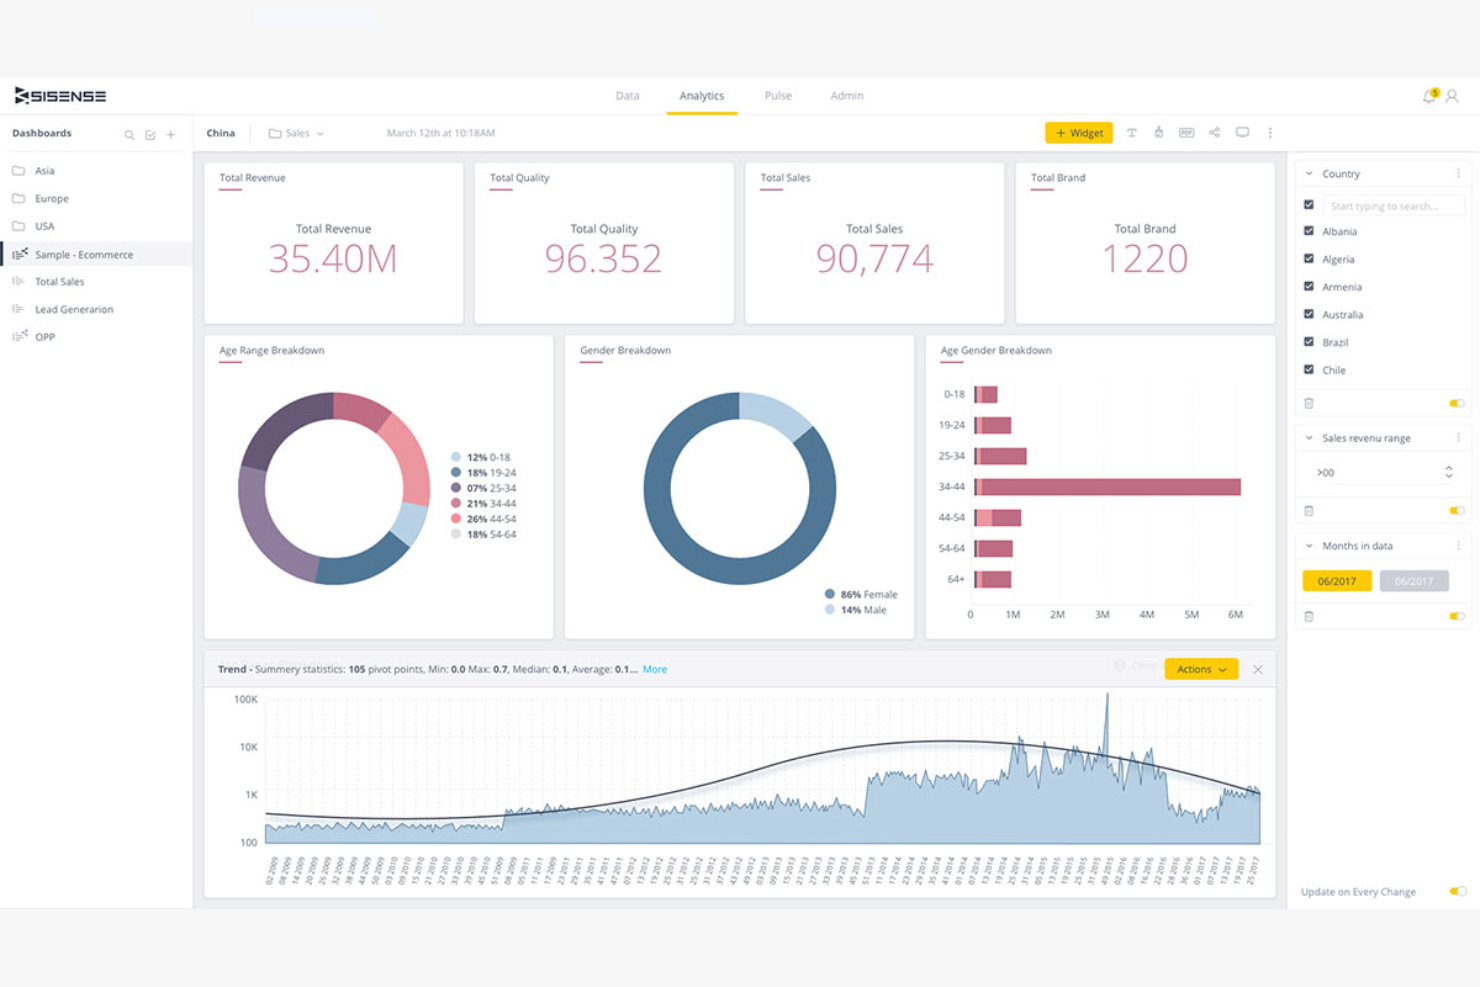
Para los equipos que buscan añadir análisis directamente a sus propios productos o portales, Sisense ofrece una plataforma flexible para el análisis integrado. Es especialmente útil para proveedores de software, plataformas de comercio electrónico y equipos de productos digitales que desean ofrecer a los usuarios paneles e informes interactivos dentro de sus propias aplicaciones. A diferencia de Tableau, Sisense está diseñado para admitir una integración profunda y el uso de marca blanca, de modo que puedes ofrecer análisis como parte de una experiencia de marca propia.
Por qué Sisense es una buena alternativa a Tableau
Si necesitas análisis que funcionen dentro de tu propio producto o portal de clientes, Sisense está diseñado específicamente para integrar análisis en las aplicaciones. Valoro que Sisense ofrezca un conjunto completo de herramientas para desarrolladores y API, para que puedas personalizar paneles, informes y visualizaciones de modo que coincidan con tu marca y experiencia de usuario. La plataforma también admite el uso de marca blanca, lo que te permite presentar los análisis como una parte integrada de tu propio software. Esto convierte a Sisense en una sólida alternativa a Tableau para los equipos que desean ofrecer análisis directamente a los usuarios finales dentro de su propio entorno.
Funciones clave de Sisense
Otras funciones de Sisense que pueden interesar a los compradores de soluciones de análisis incluyen:
- Motor de datos elástico: Procesa y analiza grandes volúmenes de datos procedentes de múltiples fuentes en tiempo real.
- Análisis basados en AI: Utiliza herramientas de AI integradas para generar información útil y automatizar la exploración de datos.
- Modelado de datos personalizado: Crea y gestiona modelos de datos complejos directamente dentro de la plataforma.
- Controles de acceso basados en roles: Asigna permisos y gestiona el acceso de los usuarios a datos y paneles confidenciales.
Integraciones de Sisense
Las integraciones incluyen Salesforce, Google Analytics, Snowflake, Amazon Redshift, Google BigQuery, Azure SQL, MySQL y PostgreSQL.
Pros and Cons
Pros:
- Análisis integrados para productos SaaS y portales de clientes
- Escalabilidad para grandes empresas que ofrecen análisis a muchos usuarios
- Implementación en la nube con API para la integración de inteligencia empresarial
Cons:
- La implementación y la configuración pueden llevar mucho tiempo
- Los modelos de precios suelen estar diseñados para implementaciones a escala empresarial

Ideal para la captura automática de datos de eventos

A diferencia de la mayoría de las plataformas de análisis, Heap captura automáticamente cada interacción de los usuarios en tu sitio web o aplicación sin necesidad de etiquetado manual. Esto resulta especialmente atractivo para los equipos de comercio electrónico, producto y UX que desean analizar los recorridos de los usuarios e identificar puntos de fricción con una configuración mínima. Si buscas un software de análisis que reduzca las brechas de seguimiento y revele rápidamente información sobre el comportamiento, Heap ofrece un enfoque único en comparación con Tableau y otras herramientas.
Por qué Heap es una buena alternativa a Tableau
Lo que diferencia a Heap de Tableau es su capacidad para capturar automáticamente cada evento de usuario en tu sitio web o aplicación sin requerir etiquetado manual. Elegiría Heap para equipos que desean analizar el comportamiento de los usuarios en detalle sin la carga de configurar cada evento. La función de captura automática de Heap registra clics, envíos de formularios y visualizaciones de páginas desde el primer momento, por lo que nunca te pierdes interacciones clave. Esto la convierte en una opción sólida para cualquiera que necesite datos detallados sobre el comportamiento con una configuración mínima.
Funciones principales de Heap
Otras funciones de Heap que pueden resultar útiles para los equipos de análisis incluyen:
- Reproducción de sesiones: Mira grabaciones anonimizadas de las sesiones de los usuarios para ver exactamente cómo interactúan los visitantes con tu sitio o aplicación.
- Análisis retrospectivo: Analiza datos históricos de nuevos eventos o propiedades sin tener que volver a etiquetar ni implementar de nuevo el seguimiento.
- Enriquecimiento de datos: Combina los datos de eventos capturados con atributos de usuario de tu CRM u otros sistemas para realizar análisis más profundos.
- Mapas de recorridos: Visualiza los recorridos completos de los usuarios en varias sesiones para identificar comportamientos comunes y puntos de abandono.
Integraciones de Heap
Entre las integraciones se incluyen LaunchDarkly, Looker Studio, Stripe, Mailchimp, Shopify, Klaviyo, Braze, Marketo, SendGrid, Zapier, JumpCloud y muchas más.
Pros and Cons
Pros:
- El seguimiento automático de eventos simplifica el análisis de datos para los equipos de producto
- El análisis retrospectivo permite a los usuarios empresariales explorar datos históricos
- La plataforma en la nube admite análisis de comportamiento para empresas emergentes y compañías SaaS
Cons:
- Los modelos de precios no son transparentes para las empresas en crecimiento
- Las capacidades de visualización son limitadas en comparación con las herramientas de BI especializadas

Countly
Ideal para obtener información en tiempo real sobre aplicaciones móviles
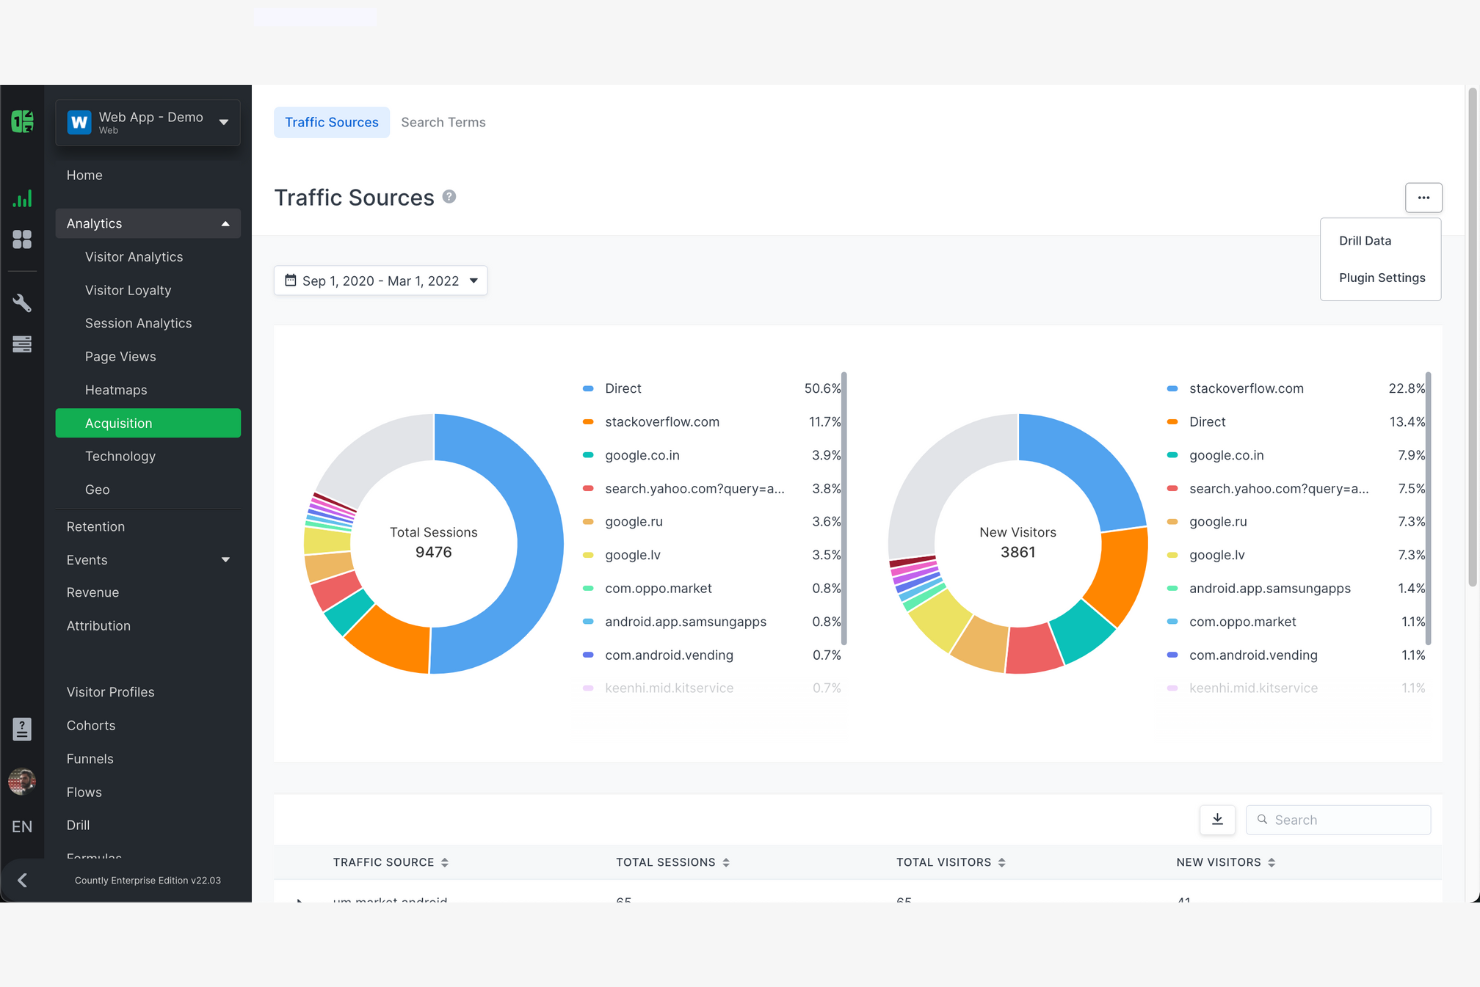
Si necesitas hacer un seguimiento del comportamiento y el rendimiento de los usuarios en aplicaciones móviles a medida que ocurren, Countly está diseñado para ti. Esta plataforma está pensada para gerentes de producto, desarrolladores de aplicaciones y equipos digitales que desean obtener información en tiempo real sobre el uso y la interacción con aplicaciones móviles. A diferencia de Tableau, Countly se especializa en análisis móviles y ofrece seguimiento basado en eventos y análisis dentro de la aplicación que te ayudan a identificar rápidamente tendencias y problemas a medida que los usuarios los experimentan.
Por qué Countly es una buena alternativa a Tableau
Para los equipos centrados en el análisis de aplicaciones móviles, Countly ofrece capacidades que Tableau no incluye de forma nativa. Elegí Countly porque proporciona un seguimiento en tiempo real basado en eventos que permite supervisar las acciones de los usuarios y el rendimiento de la aplicación a medida que ocurren. Puedes configurar paneles personalizados para visualizar eventos dentro de la aplicación, fallos y flujos de usuarios sin esperar al procesamiento de datos por lotes. El enfoque de Countly en métricas específicas para móviles lo convierte en una opción sólida para cualquiera que necesite información inmediata y práctica a partir de los datos de su aplicación.
Características principales de Countly
Otras características de Countly que los compradores de soluciones de análisis pueden querer conocer incluyen:
- Segmentación de usuarios: Agrupa a los usuarios según su comportamiento, datos demográficos o propiedades personalizadas para realizar análisis específicos.
- Módulo de pruebas A/B: Realiza experimentos dentro de tu aplicación para comparar el rendimiento de las funciones y la respuesta de los usuarios.
- Análisis de notificaciones push: Supervisa la entrega, las tasas de apertura y la interacción de las campañas de notificaciones push dentro de la aplicación.
- Controles de privacidad de datos: Gestiona el consentimiento de los usuarios y la configuración de conservación de datos para cumplir con los requisitos normativos.
Integraciones de Countly
Entre las integraciones se incluyen Okta, Elestio, Zapier, Slack y Salesforce.
Pros and Cons
Pros:
- Análisis de datos en tiempo real para aplicaciones móviles y productos digitales
- Plataforma en la nube o implementación local para una escalabilidad flexible
- Herramientas de segmentación de usuarios para obtener información sobre el comportamiento y la interacción
Cons:
- Las funciones de visualización son menos avanzadas que las de las herramientas empresariales de inteligencia de negocios
- La configuración de informes puede requerir mucho tiempo para necesidades de análisis complejas

PostHog
Ideal para obtener flexibilidad en la implementación autohospedada
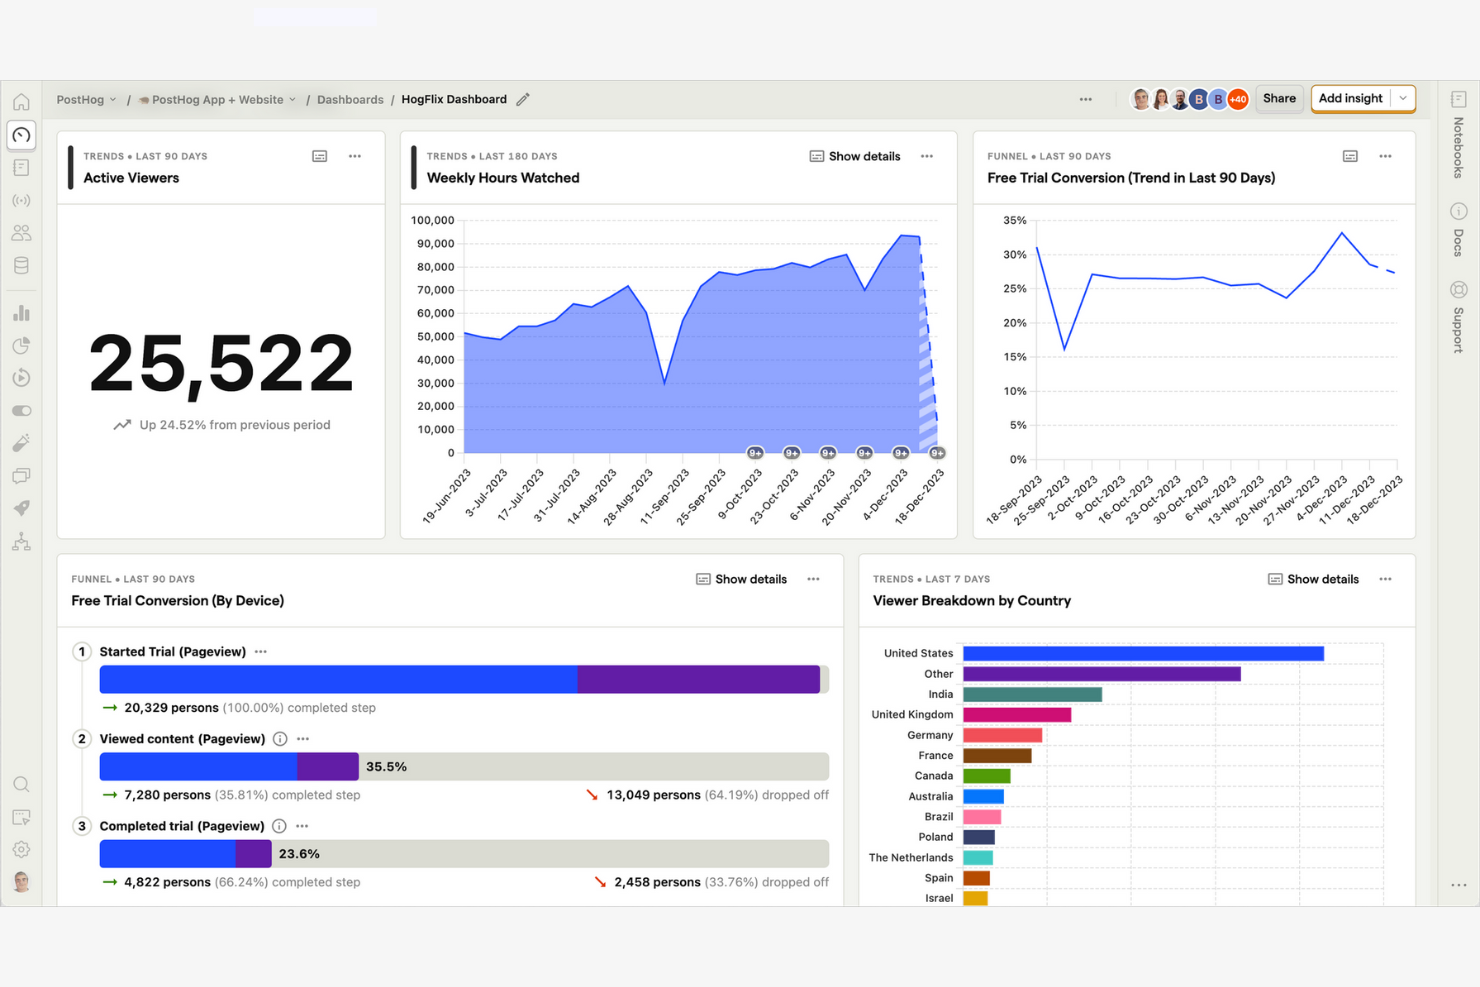
Para los equipos que necesitan un control total sobre su infraestructura de análisis, PostHog ofrece una solución flexible autohospedada. Es una opción especialmente adecuada para organizaciones impulsadas por la ingeniería, empresas SaaS y negocios preocupados por la privacidad que quieren implementar análisis en sus propios servidores. A diferencia de Tableau, PostHog combina análisis de productos, grabación de sesiones y gestión de indicadores de funcionalidades en una sola plataforma que puede ejecutar en cualquier lugar.
Por qué PostHog es una buena alternativa a Tableau
Si necesita un software de análisis que pueda controlar por completo e implementar en su propia infraestructura, PostHog destaca frente a Tableau. Elegí PostHog porque ofrece una opción de implementación autohospedada, lo que permite mantener los datos confidenciales en las instalaciones o en su nube privada. La plataforma incluye análisis de productos, grabación de sesiones y gestión de indicadores de funcionalidades, todo administrado dentro de su propio entorno. Esta flexibilidad es especialmente valiosa para las empresas con requisitos estrictos de privacidad de datos o necesidades de infraestructura personalizada.
Funciones principales de PostHog
Entre las otras funciones de PostHog que los compradores de soluciones de análisis quizá quieran conocer se incluyen:
- Captura automática de eventos: Recopila automáticamente las interacciones de los usuarios, como clics, páginas vistas y envíos de formularios, sin necesidad de etiquetado manual.
- Análisis de tendencias: Visualiza los cambios en las métricas clave a lo largo del tiempo para ayudar a detectar patrones y anomalías.
- Análisis de cohortes: Agrupa a los usuarios según comportamientos o propiedades compartidos para lograr una segmentación más detallada.
- Mercado de complementos: Ofrece una biblioteca de complementos para ampliar las funcionalidades, incluidas integraciones y herramientas de enriquecimiento de datos.
Integraciones de PostHog
PostHog se integra con GitHub, GitLab, Linear y Jira.
Pros and Cons
Pros:
- Plataforma de análisis de código abierto con opciones de implementación flexibles
- Análisis autoservicio para empresas emergentes y equipos de producto dirigidos por ingeniería
- Análisis de datos basado en eventos con sólidas capacidades de seguimiento del comportamiento
Cons:
- Las herramientas de inteligencia empresarial y las funciones de visualización son menos avanzadas que las de Tableau
- Interfaz de usuario menos intuitiva para usuarios sin conocimientos técnicos

Si necesitas un software de análisis que priorice la privacidad y la propiedad de los datos, vale la pena considerar detenidamente Matomo. Está diseñado para organizaciones, especialmente aquellas de sectores regulados o que operan en regiones con leyes de privacidad estrictas, que desean tener un control total sobre sus datos analíticos. A diferencia de Tableau y muchas otras herramientas de análisis, Matomo te permite alojar los datos en tus propios servidores y evitar el seguimiento de terceros.
Por qué Matomo es una buena alternativa a Tableau
Matomo se diferencia de Tableau al ofrecerte un control total sobre tus datos analíticos y la privacidad de los usuarios. Elegí Matomo para equipos que necesitan cumplir con estrictas normativas de privacidad o desean evitar el intercambio de datos con terceros. Con alojamiento local y herramientas integradas para cumplir con el RGPD, puedes garantizar que los datos confidenciales de los clientes nunca salgan de tu entorno. Matomo también ofrece funciones centradas en la privacidad, como el seguimiento sin cookies y la retención de datos personalizable, lo que lo convierte en una opción sólida para organizaciones preocupadas por la privacidad.
Funciones principales de Matomo
Algunas otras funciones de Matomo que los compradores de soluciones de análisis pueden querer conocer incluyen:
- Mapas de calor y grabaciones de sesiones: Visualiza dónde hacen clic los usuarios, qué partes desplazan y cuánto tiempo pasan en tu sitio.
- Paneles personalizados: Crea paneles personalizados con widgets para las métricas más importantes para tu equipo.
- Análisis del comercio electrónico: Realiza un seguimiento del rendimiento de los productos, las tasas de conversión y los ingresos de tu tienda en línea.
- Administrador de etiquetas: Administra e implementa etiquetas de marketing y análisis sin editar el código de tu sitio.
Integraciones de Matomo
Las integraciones incluyen WordPress, Drupal, Flowpack, Ghost, Shopify, Adobe Commerce, Google Looker Studio, Microsoft Power BI, Slack, Microsoft Teams y muchas más.
Pros and Cons
Pros:
- Plataforma de análisis centrada en la privacidad con control total sobre la propiedad de los datos
- Plataforma en la nube o implementación autogestionada para una escalabilidad flexible
- Herramientas de análisis de datos para el tráfico del sitio web, el comercio electrónico y el comportamiento de los usuarios
Cons:
- La interfaz de usuario es menos intuitiva que la de las herramientas modernas de inteligencia empresarial
- La configuración avanzada puede requerir mucho tiempo para los usuarios sin conocimientos técnicos
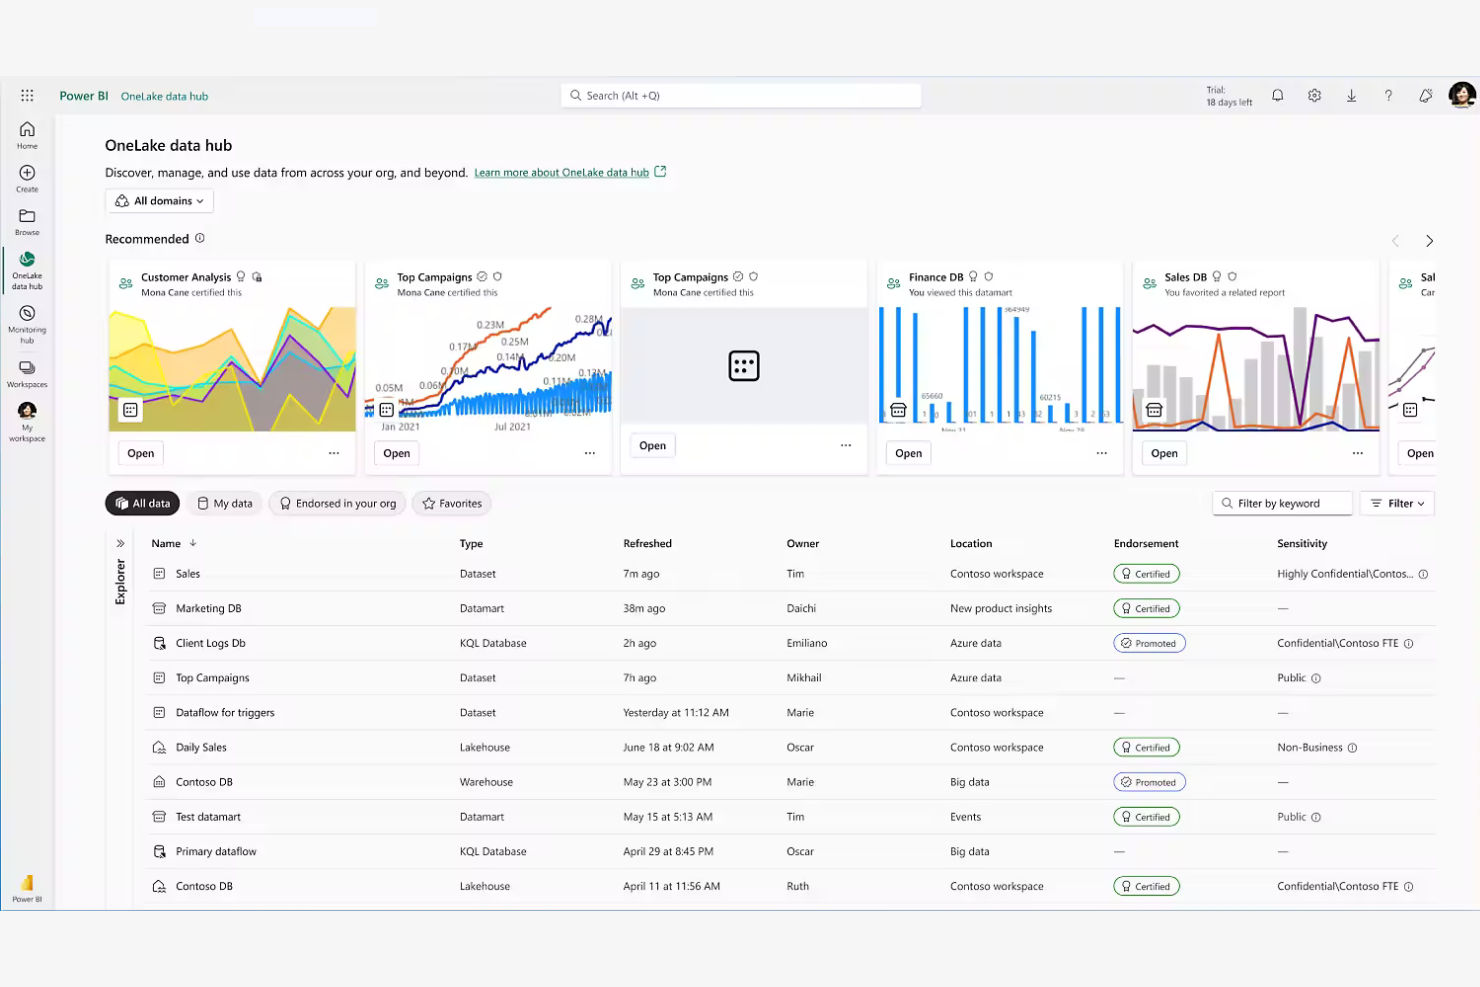
Si tu empresa ya depende de Microsoft 365, Power BI ofrece análisis que se integran directamente en tus flujos de trabajo existentes. Es especialmente útil para las organizaciones que quieren conectar datos de Excel, Teams y SharePoint sin configuraciones adicionales. Como una de las principales soluciones de BI de autoservicio del mercado, Power BI permite a los usuarios empresariales explorar datos, crear paneles y generar información útil sin un soporte técnico intensivo. A diferencia de Tableau, la profunda integración de Power BI con las herramientas de Microsoft facilita compartir paneles y automatizar informes en toda la empresa.
Por qué Microsoft Power BI es una buena alternativa a Tableau
Para los equipos que ya han invertido en Microsoft 365, Power BI ofrece capacidades de análisis que funcionan de forma nativa con las herramientas que utilizas a diario. Elegí Power BI porque se conecta directamente con Excel, Teams y SharePoint, lo que facilita incorporar datos y colaborar en informes. La plataforma también admite actualizaciones automáticas de datos y el uso compartido a través del entorno seguro en la nube de Microsoft. Este nivel de integración ayuda a tu empresa a mantener los análisis y los informes estrechamente alineados con las operaciones diarias.
Características principales de Power BI
Algunas otras características de Power BI que los compradores de soluciones de análisis pueden querer conocer incluyen:
- Herramientas de modelado de datos: Crea modelos de datos complejos mediante relaciones, columnas calculadas y fórmulas DAX.
- Información basada en IA: Utiliza inteligencia artificial integrada para detectar tendencias, pronosticar resultados y generar resúmenes en lenguaje natural.
- Mercado de visualizaciones personalizadas: Accede a una biblioteca de visualizaciones personalizadas para mejorar tus paneles e informes.
- Seguridad a nivel de fila: Controla el acceso a los datos definiendo permisos específicos para cada usuario dentro de los informes.
Integraciones de Power BI
Las integraciones incluyen Excel, SharePoint, Microsoft Teams, Azure SQL Database, Dynamics 365, Salesforce, Google Analytics, SAP HANA, Oracle Database y GitHub.
Pros and Cons
Pros:
- Herramientas de inteligencia empresarial integradas con el ecosistema de Microsoft 365
- Análisis de autoservicio con una interfaz fácil de usar para usuarios empresariales
- Plataforma en la nube escalable que admite desde empresas emergentes hasta grandes empresas
Cons:
- El modelado con DAX presenta una curva de aprendizaje pronunciada para los nuevos usuarios
- Algunas funciones avanzadas están limitadas a modelos de precios superiores

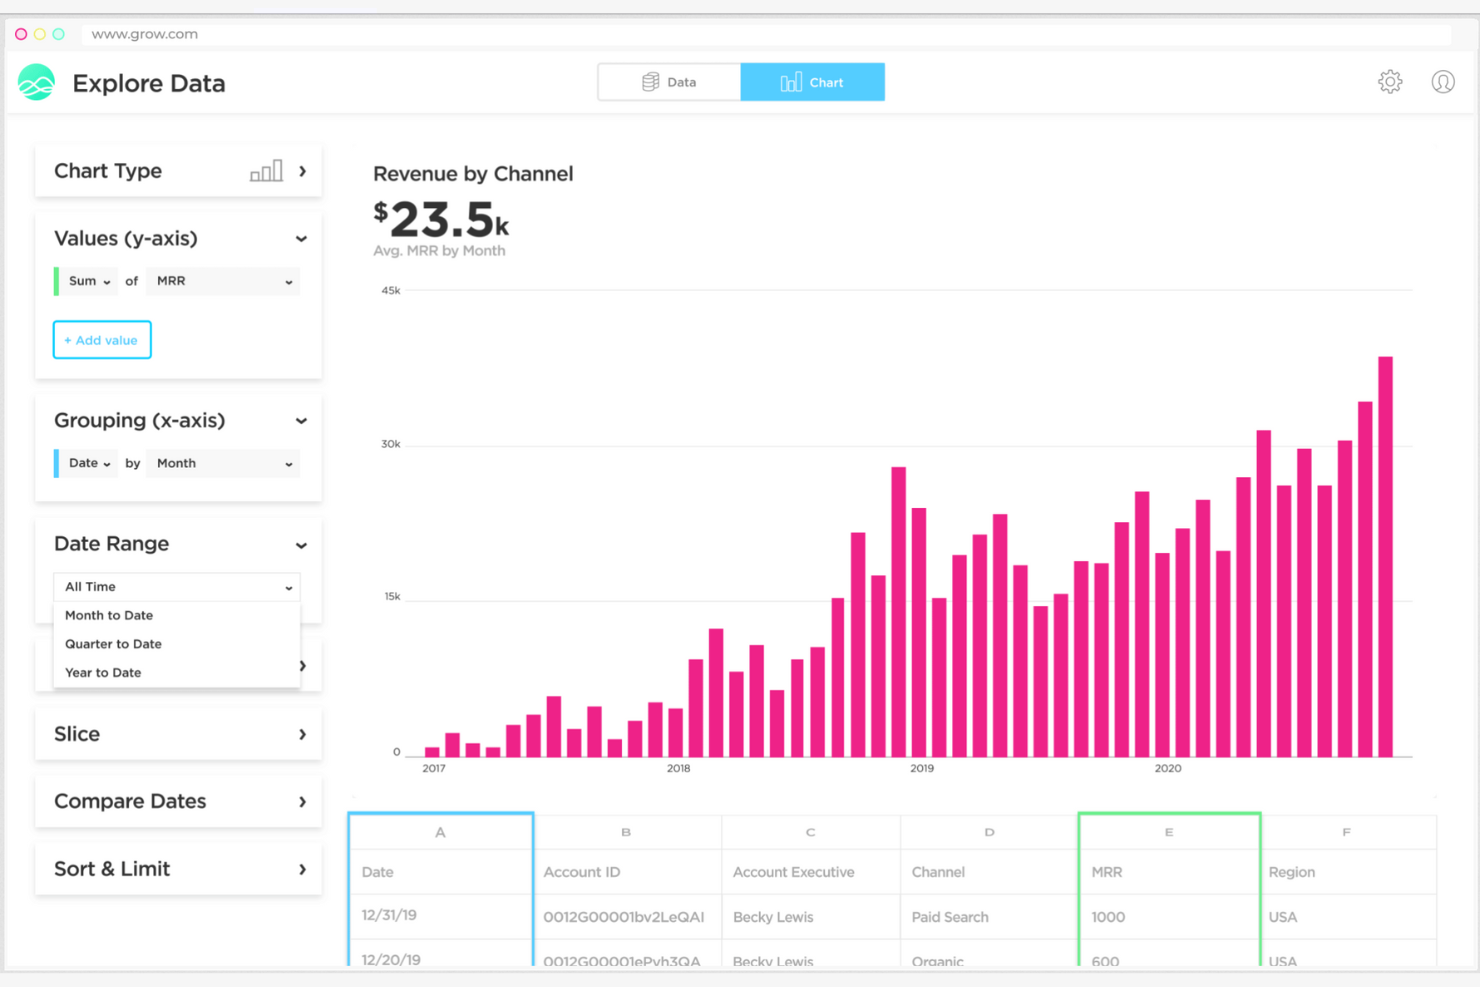
Si tu equipo necesita paneles que coincidan con tus métricas empresariales exactas, Grow te ofrece control total sobre la forma de visualizar y organizar tus datos. Es una opción adecuada para equipos de comercio minorista y comercio electrónico que desean combinar datos de múltiples fuentes y diseñar paneles adaptados a sus indicadores clave de rendimiento. A diferencia de Tableau, Grow hace hincapié en la personalización sin código y en los diseños flexibles de los paneles, para que puedas adaptar los análisis a tus flujos de trabajo específicos.
Por qué Grow es una buena alternativa a Tableau
Lo que distingue a Grow como alternativa a Tableau es su enfoque en la creación de paneles personalizables para equipos que desean análisis adaptados a su negocio. Me gusta que Grow te permita crear paneles desde cero mediante un editor de arrastrar y soltar, para que puedas organizar gráficos, tablas y visualizaciones exactamente como quieras. La plataforma también admite cálculos y métricas personalizados, lo que te permite definir los indicadores clave de rendimiento más importantes para tu negocio. Esta flexibilidad convierte a Grow en una opción sólida si necesitas paneles que se adapten a tus necesidades específicas de generación de informes.
Funciones principales de Grow
Algunas otras funciones de Grow que los compradores de soluciones de análisis pueden querer conocer incluyen:
- Combinación de datos: Combina datos de múltiples fuentes en una única vista del panel.
- Informes programados por correo electrónico: Envía capturas automatizadas de los paneles a los miembros del equipo según un horario establecido.
- Conectores de datos prediseñados: Conéctate rápidamente a fuentes de datos populares como Shopify, Salesforce y Google Analytics.
- Gestión de permisos de usuarios: Establece distintos niveles de acceso para los usuarios y controla quién puede ver o editar los paneles.
Integraciones de Grow
Las integraciones incluyen Salesforce, Google Analytics, Shopify, HubSpot, QuickBooks, Stripe, Google Sheets y MySQL.
Pros and Cons
Pros:
- Interfaz intuitiva diseñada para usuarios no técnicos que crean paneles
- Herramientas de análisis de autoservicio para pequeñas empresas y empresas emergentes
- La configuración rápida reduce el tiempo necesario para desarrollar informes
Cons:
- Los modelos de precios no son completamente transparentes sin contactar con el equipo de ventas
- Funciones avanzadas limitadas en comparación con las herramientas de inteligencia empresarial para empresas
Otras alternativas a Tableau
Estas son algunas opciones adicionales de alternativas a Tableau que no han entrado en mi selección, pero que aun así merece la pena consultar:
- SAS
Ideal para el modelado estadístico avanzado
- Paylocity
Ideal para la integración del análisis de la fuerza laboral
- Qlik Sense
Ideal para la exploración de datos asociativos


Cómo evalúo las alternativas a Tableau
Divido las evaluaciones en dos niveles: las capacidades esenciales que convierten a una herramienta en una verdadera alternativa a Tableau y los elementos diferenciadores, como los conectores específicos para el comercio minorista o los datos de POS en tiempo real, que distinguen a las mejores.
Funcionalidad esencial (requisitos básicos para esta lista)
Al seleccionar las herramientas para mi lista, clasifico cada una en una escala de 0 (no ofrece la funcionalidad) a 5 (sobresale en esta área) para cada funcionalidad esencial que se indica a continuación. Después, calculo la puntuación total de la herramienta como porcentaje. Cada herramienta debe alcanzar una puntuación total mínima del 65% para ser considerada para su inclusión.
- Visualización interactiva de datos: Evalúo la variedad de tipos de gráficos y la interactividad: desgloses, filtros cruzados y detalles al pasar el cursor que permiten a un analista de comercialización pasar de una visión general de las ventas regionales al rendimiento de SKU a nivel de tienda con unos pocos clics.
- Conectividad con múltiples fuentes de datos: Los datos del comercio minorista se encuentran repartidos entre los sistemas de POS, ERP, comercio electrónico y las hojas de cálculo, por lo que compruebo la disponibilidad de conectores nativos para sistemas como Shopify y NetSuite, así como para almacenes de datos en la nube como Snowflake o BigQuery.
- Análisis de autoservicio: Busco la creación de informes mediante arrastrar y soltar, además de una exploración guiada que un responsable de categoría pueda utilizar para responder preguntas ad hoc sobre márgenes sin enviar una solicitud al equipo de datos.
- Uso compartido y colaboración en paneles: La distribución es importante entre tiendas y regiones, por lo que evalúo los informes programados, el uso compartido basado en roles, los comentarios y las opciones de paneles integrados que mantienen alineadas a las partes interesadas.
- Modelado y transformación de datos: Combinar las transacciones de POS con los datos de inventario y los calendarios promocionales requiere combinaciones, campos calculados e, idealmente, una capa semántica reutilizable; compruebo cómo gestiona cada herramienta ese trabajo de preparación.
- Opciones de implementación escalables: Considero si una herramienta admite alojamiento en la nube, local o híbrido, junto con acceso basado en roles y seguridad a nivel de fila, adecuados para organizaciones minoristas con múltiples tiendas y equipos regionales diferenciados.
Una vez que tengo una lista de herramientas que cumplen estos criterios, considero qué distingue a cada plataforma.
Factores diferenciadores (qué distingue a los proveedores)
Así es como comparo y contrasto los distintos proveedores:
Características destacadas
Los datos obtenidos mediante inteligencia artificial son un elemento diferenciador clave. Las herramientas que detectan anomalías en las tasas de venta o alertan sobre disminuciones inesperadas del inventario ofrecen a los analistas una ventaja inicial frente al análisis manual de informes. También evalúo el análisis móvil, ya que los responsables de tienda necesitan acceder desde el establecimiento a las ventas diarias y a los KPI de personal sin abrir un portátil. La transmisión de datos en tiempo real es importante durante las temporadas de mayor actividad, cuando los datos en directo del POS ayudan a los equipos de operaciones a reaccionar ante las faltas de existencias o al rendimiento de las promociones durante el mismo turno.
Más allá de las características
El coste total de propiedad es algo que sopeso detenidamente. Las licencias por usuario pueden aumentar rápidamente cuando se implementan paneles para cientos de responsables de tienda, por lo que comparo los modelos de precios para ver cuáles se adaptan mejor a los equipos minoristas con muchos usuarios que solo consultan. Las integraciones con la pila tecnológica del comercio minorista también son importantes: una herramienta que se conecta de forma nativa con el POS, el ERP y la plataforma de comercio electrónico reduce la carga de ingeniería de datos. También analizo la gobernanza y el cumplimiento normativo, especialmente en relación con PCI DSS y la gestión de los datos de los clientes, ya que los análisis del comercio minorista suelen manejar datos de pago a nivel de transacción.
¿Por qué buscar una alternativa a Tableau?
Aunque Tableau es una buena opción de software de análisis, hay varios motivos por los que algunos usuarios buscan soluciones alternativas. Puede que estés buscando una alternativa a Tableau porque…
- Necesitas integrar los análisis directamente en tus propias aplicaciones
- Tu equipo necesita capacidades más avanzadas de modelado de datos
- Quieres opciones de precios más transparentes o flexibles
- Necesitas una mejor compatibilidad con datos en tiempo real o en streaming
- Tu organización necesita funciones de marca blanca o de personalización de marca
Si alguna de estas situaciones te resulta familiar, has llegado al lugar adecuado. Mi lista contiene varias opciones de software de análisis más adecuadas para los equipos que se enfrentan a estos desafíos con Tableau y buscan soluciones alternativas.
Características principales de Tableau
Estas son algunas de las características principales de Tableau para ayudarte a contrastar y comparar lo que ofrecen las soluciones alternativas:
- Generador de paneles e informes mediante arrastrar y soltar
- Amplia variedad de opciones de visualización de datos
- Compatibilidad con conexiones de datos en directo y programadas
- Capacidades de filtrado interactivo y análisis detallado
- Herramientas integradas de preparación y limpieza de datos
- Funciones de colaboración y uso compartido para equipos
- Paneles e informes optimizados para dispositivos móviles
- Integración con Salesforce y otras plataformas principales
- Análisis avanzado con campos calculados y previsiones
- Controles de acceso basados en roles para la seguridad de los datos
Qué viene después:
Si estás investigando alternativas a Tableau, conecta con un asesor de SoftwareSelect para obtener recomendaciones gratuitas.
Rellenarás un formulario y mantendrás una breve conversación en la que analizarán los detalles específicos de tus necesidades. Después, recibirás una lista de software preseleccionado para revisar. Incluso te ayudarán durante todo el proceso de compra, incluidas las negociaciones de precios.