How To Calculate Safety Stock: 6 Formulas


Safety Stock—Not Just a Good Guess: Relying on rules of thumb for safety stock can lead to inventory issues. Transitioning to SKU-specific calculations is essential for better accuracy and inventory management.
Tailored Safety Stock for Success: One-size-fits-all safety stock levels are inadequate. Calculating specific levels for each SKU helps overcome inventory challenges and better address unique supply chain needs.
Data-Driven Stock Decisions: Learn to perform accurate safety stock calculations using essential data inputs and established formulas, which ensure better planning and reliability in the face of disruptions.
Avoiding Stock Calculation Pitfalls: The article provides a list of do’s and don’ts to guide precise safety stock calculations, helping avoid common pitfalls and enhancing inventory management.
Three Steps to Safety Stock Mastery: Explore actionable strategies to implement effective safety stock practices that account for unique variabilities in demand, supply chain delays, and contribute to a more stable inventory.
Are you using safety stock “rules of thumb” like calculating 10 to 20% of cycle stock or defaulting to two weeks of coverage?
Maybe you’re starting to realize these one-size-fits-all shortcuts may have worked at first, but you’ve completely outgrown them. It’s now causing you so much inventory trouble.
In this post, you’ll learn why relying on blanket buffers isn’t enough and why you need to move toward calculated, SKU-specific safety stock levels.
Plus, you’ll get everything you need to build accurate, confident safety stock calculations, including the core data inputs, tried-and-true formulas, a list of do’s and don’ts, and three ways to put it all into action.
What is Safety Stock?
Safety stock is extra inventory kept on hand in case of disruptions, such as supplier delays, shipping issues, or sudden spikes in demand.
It’s a critical input for calculating reorder points (ROP) and directly influences how much inventory you replenish.

Imagine a brand called Fir and Loom, preparing for the holiday season. Unexpectedly, a social media post gets one of their bestsellers, the merino hoodie, trending.
Good thing their ops team had accounted for surprises like this.
Even when suppliers are already at full capacity, their level of safety stock allows them to fulfill the surge of customer demand.
Safety stock shouldn’t be confused with buffer stock, a reserve of inventory to manage regular variability in customer demand and production flow.
Mark Anderson, an expert on lean manufacturing, weighs in on their differences:
Buffer stock is meant to protect your customer from you, the producer, in case there’s an unexpected increase in demand.
On the other hand, safety stock is meant to protect you from the incapability of your upstream processes and suppliers
LeanVlog
Both help protect your supply chain, but they target different parts of it.
When to Recalculate Safety Stock
Recalculating safety stock is non-negotiable for optimizing your inventory, because your business needs, market demand, and the industry are always changing.
But when should you carry out the recalculation?
Check out these top triggers to determine if it's time to give your safety stock another update:
New supplier or major lead-time shift
Switching suppliers or experiencing major lead-time changes can throw off your usual inventory flow.
Maybe the new supplier is slower, or the lead time has stretched unexpectedly. Either way, these variations introduce inventory risks that can lead to stockouts or excess inventory if not accounted for.
Promo period or seasonal swing
Promos and holidays drive big spikes in demand. In 2024, US retail sales hit a record $994.1 billion—up 4% from the previous holiday season.
If you just reuse last year’s safety stock, you may sell out too soon and leave money on the table. One holiday bump could wipe you out overnight.
Big spike or dip in demand patterns
Sudden demand spikes or slowdowns, whether temporary virality or permanent market shifts, can drastically affect your forecast.
The new patterns introduce variables that weren't considered in your original calculations. Regular recalibration helps you stay agile in a fast-changing market, outpace competitors, and capitalize on emerging trends.
System or team-wide process change
New systems always mean new friction.
Technology changes, process changes, or warehouse workflows can cause data discrepancies, delayed updates, or an inability to communicate between backend systems.
In fact, only retailers using RFID technology see over 90% inventory accuracy. And those without it struggle due to poor backend system integration.
Don’t assume old allowances still work. Recheck your numbers always to improve your inventory management strategy.
The Costs Of Getting Safety Stock Wrong
If safety stock seems like a safety net, that’s because it’s exactly what it is.
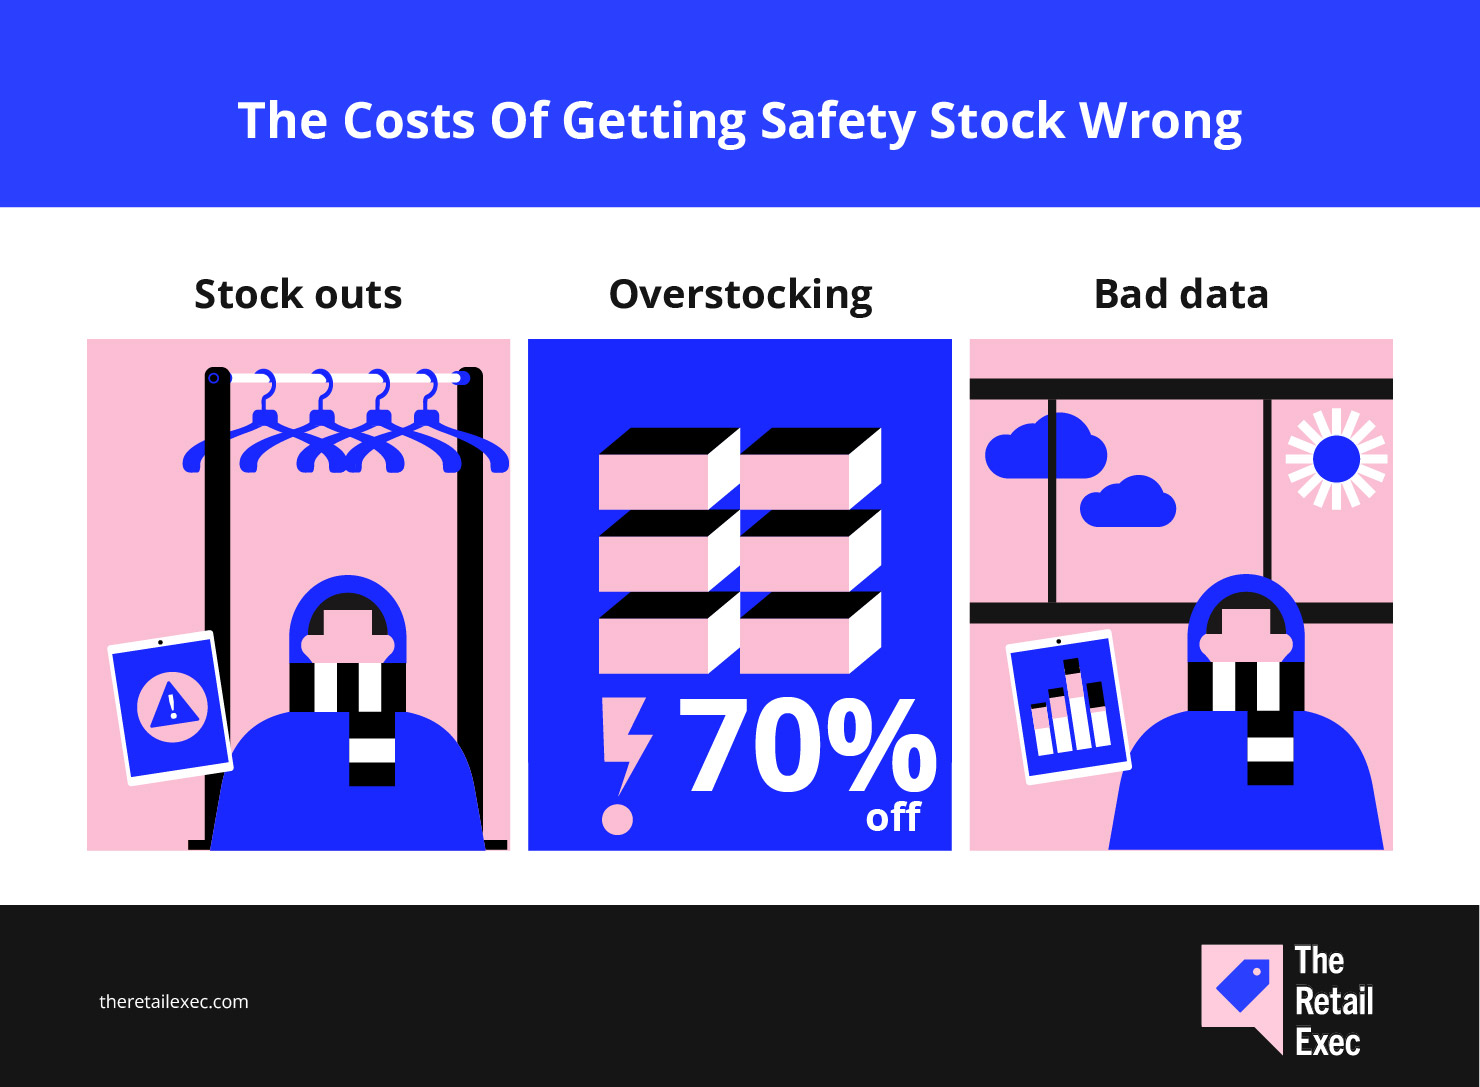
If you skip it or miscalculate it, you risk falling into the following traps that can quietly drain profits or, over time, threaten your operations:
- Stockouts. Running out of stock can lead to lost sales and affect how your customers perceive you. Research shows that this can result in customer dissatisfaction, reduced loyalty, and negative word-of-mouth.
Should Fir and Loom underestimate their safety stock and run out of their best-selling merino hoodie right at the start of their seasonal marketing drive, they'll miss out on both revenue and repeat business.
- Overstocking: Products sitting unsold freeze your assets. Carrying costs alone can take up to 30% of total inventory value.
If Fir and Loom overestimate their safety stock level, they'll have to resort to offering steeper discounts to clear space and reduce losses.
- Bad data = bad buffers: Averages hide swings, so it’s harder to pinpoint when and how you actually need. When you don’t account for demand variability, even a slight shift can throw your entire inventory plan off balance.
If Fir and Loom rely on averages from a calm quarter to forecast for Q4, they might stock too little, too late.
Ideally, safety stock should be backed up by accurate information. We’ll discuss what these are in the next section.
Core Inputs You Need for Calculation (And How To Clean Them)
At a minimum, you need the following inputs:
Average daily usage (ADU)
Average daily usage (ADU) is the number of units you sell or consume each day. Since safety stock is there to cover demand uncertainty, you must use historical sales data (not forecasts).
Use a consistent time window—the past 30, 60, or 90 days—and exclude zero-sale days during stockouts. (You didn’t sell anything because you had nothing to sell.)
Don’t forget to filter out outliers like flash sales and off-season days that can inflate or deflate your average.
Lead‑time variability
Lead-time variability accounts for delivery fluctuations due to supplier stockouts, customs issues, or routing errors.
Track your supplier’s delivery times over a set time period and calculate the standard deviation. The more erratic the lead times, the higher the safety stock.
Desired service level
Your desired service level is the percentage of orders you want to fulfill on time.
- High-demand or high-margin SKUs may require 98 to 99% to minimize the risk of stockouts.
- For slower-moving ones, 90 to 95% can offer a smarter cost-risk tradeoff.
Don’t shortcut this and apply the same target to every SKU.
Use ABC inventory analysis, margin sensitivity, or simulation-based tools like Monte Carlo to prioritize and set smarter service levels. That way, you don’t overstock items that don’t need extra buffers.
Many inventory management teams will pick service levels and insert them into a formula to determine the required safety stock for that level. This is putting the cart before the horse.
6 Safety Stock Formulas—Which One Fits Your Brand?
Holding extra inventory clutters your backroom and ties up cash. It pays to be smart about how much safety stock to procure.
Determine the right amount of buffer for sudden sales surges, supplier hiccups, or future campaigns with these six methods.
1. Basic safety stock formula
Safety Stock = Average Sale × Average Lead Time
This safety stock calculation offers basic estimates when you don’t have a lot of sales data to work with.
Say, Fir and Loom sells an average of 50 of their merino hoodies daily, and it often takes 5 days to restock them.
So that’s:
50 × 5 = 250
Meaning: Fir and Loom will need 250 safety stocks to avoid shortages.
This formula assumes everything is average and doesn’t account for real-time delivery or demand fluctuations.
You’ll see more advanced formulas to accommodate sales and demand performance and supply chain disruptions.
2. Average-max safety stock formula
Safety Stock = (Maximum Lead Time × Maximum Sale) – (Average Lead time × Average Sale)
The average-max method adds a smarter buffer by comparing your worst-case scenario with your average. It’s still straightforward but reacts better to lead time variability.
Fir and Loom’s daily merino hoodie sales average 50 but can spike to 80. Meanwhile, their average 5-day lead time can stretch to 9 during holidays.
This means:
(9 × 80) – (5 × 50) = 720 – 250 = 470
Fir and Loom will need 470 extra hoodies to meet customer demand in case delivery takes longer than expected.
3. Demand-based normal distribution
Safety Stock = Z × σd × √LT
Where:
- Z = Z score for your desired service level
- σd = Standard deviation of demand
- LT = Average lead time
This normal distribution formula calculates how much safety stock to keep when there’s uncertainty in customer demand.
The Z score represents the desired service level. You can use a statistical calculator or look up a Z-table to get Z scores for different service levels.
Here’s a quick Z-table reference:
| Percentile | Z scores |
|---|---|
| 99% | 2.326 |
| 98% | 2.054 |
| 97% | 1.881 |
| 96% | 1.751 |
| 95% | 1.645 |
| 94% | 1.555 |
| 93% | 1.476 |
| 92% | 1.405 |
| 91% | 1.341 |
| 90% | 1.282 |
On the other hand, the standard deviation is how “bouncy” your daily sales are around the average. You can calculate σd in Excel using the STDEV.P function.
Let’s assume Fir and Loom’s daily ups and downs average out to a σd of 20 merino hoodies. They also plan to meet customer demand 95% of the time (Z = 1.645).
Plugging in these figures, we’ll get:
1.645 × 20 × √5 = 73.56
This means Fir and Loom needs to have 74 extra stocks on hand to maintain a 95% fill rate even when there are spikes.
4. Lead-time-based normal distribution
Safety Stock = Z × Average Sales × σLT
To get:
σLT = Standard Deviation of Lead Time
This safety stock calculation determines the amount of inventory required to cover predictable demand while accounting for erratic shipping.
It’s best used when you have a consistent sales pattern, but your supplier experiences delays due to holidays, strikes, or transport issues.
If Excel’s STDEV.P function calculates that Fir and Loom’s σLT is 2 days, most of their lead times will fall within the range of 3 to 7 days (5 ± 2 days).
The equation should look like:
1.645 × 50 × 2 = 164.5
Fir and Loom needs 165 merino hoodies to meet the 95% service level despite lead time variability.
5. Independent variability (uncertainty in both demand and lead time)
Safety Stock = Z × √[(σd² × LT) + (Average Sales² × σLT²)]
Sometimes demand can surge from promotions or viral trends. Other times, it’s the suppliers who face stockouts or transport delays.
While these two things don’t directly influence each other, this method helps you buffer against both uncertainties.
To exemplify independent variability for Fir and Loom’s bestseller, let’s use the same figures as above:
- Average sales = 50 hoodies per day
- LT = 5 days
- Z = 1.645 for 95% service level
- σd = 20 hoodies
- σLT = 2 days
The optimal safety stock level computation would look like:
1.645 × √[(20² × 5) + (50² × 2²)] = 180.2
Fir and Loom requires 180 merino hoodies to enjoy enough cushion to prep their retail shop for the unexpected.
6. Dependent variability (correlated uncertainty)
Safety Stock = Z × √[(σd × LT + Average Sale × σLT)²]
In dependent variability, demand and lead time are correlated.
When demand spikes during holiday surges or drops during supply chain crunches, lead times often rise or fall alongside it.
The dependent variability method offers a higher safety stock to cover the compounded risks of these two factors happening simultaneously.
Plugging in the same numbers, Loom and Fir gets:
1.645 × √[(20 × 5 + 50 × 2)²] = 329
To have enough stock in such cases, they’ll need to hold about 329 more hoodies.
How to Choose the Right Safety Stock Formula
It’s confusing.
Looking above, we arrived at different numbers as we introduced more information and used different conditions.
This goes to show that the optimal formula for safety stock calculation depends on your inventory pain point, available data, and goal.
Use this cheat sheet to match the formula to your scenario:
| Business scenario | Use this formula | Why it works |
|---|---|---|
| Launching a new product with little to no sales data | Basic formula SS = Avg Sale × Avg LT | Gives a fast, directional estimate. Good for new products or startups with limited data. |
| Supplier delays during seasonal spikes | Average-Max formula SS = (Max LT × Max Sale) − (Avg LT × Avg Sale) | Builds in a buffer for occasional supplier delays without bloating stock. |
| Consistent sales, but stockouts still happen | Demand variability only SS = Z × σd × √LT | Accounts for demand spikes when lead time is stable. |
| Inconsistent shipping times, but steady demand | Lead time variability only SS = Z × Avg Sale × σLT | Smooths out random delays when customer demand is predictable. |
| Both demand and lead time fluctuate independently | Independent variability SS = Z × √[(σd² × LT) + (Avg Sale² × σLT²)] | Balances both sources of variability with a mathematically grounded buffer. |
| Demand and lead time spike together (e.g., during Black Friday) | Dependent variability SS = Z × √[(σd × LT + Avg Sale × σLT)²] | Assumes worst-case compounding—creates a larger buffer when chaos hits. |
3 Ways to Calculate Safety Stock (With One Clear Winner)
Following that intense formula fest, I come bearing good news: It isn't your job to master all of them.
Here are three practical ways to get the right safety stock calculations, each with its own level of effort and accuracy.
The spreadsheet route
Perhaps the most old school of the three, the spreadsheet route, has served companies well for years, and still does for many.
Here’s the “spreadsheet route” laid out step-by-step. You can use any of the safety stock calculation formulas above.
- Gather and clean demand data. Pull 6–12 months of sales history into your sheet. Scan for obvious outliers (e.g., one-off promotional spikes or data entry errors) and remove or flag them, so the dataset reflects typical demand patterns.
- Calculate demand variability. In a new column, run STDEV.S (Excel) or STDEV (Google Sheets) on your cleaned sales range. For low-volume SKUs, aggregate by week (rather than day) for a more stable measure of volatility.
- Gather and clean lead-time data. Export your purchase orders with both expected and actual arrival dates. Early arrivals should be considered as negative variances because they still affect overall consistency.
- Calculate lead-time variability. Create a “lead-time variance” column (Actual – Expected) and apply STDEV.S to that range. Highlight SKUs with lead-time standard deviation that exceeds ~25 % of their mean lead time. They pose higher risks.
- Pick service level & Z-score. Insert a tiny lookup table mapping common service levels (90%, 95%, 98%) to their Z-scores (1.28, 1.65, 2.06). Use VLOOKUP (or INDEX/MATCH) so that changing the service level automatically pulls in the correct Z-value.
- Apply your chosen formula. Set up one column per calculation method. Use conditional formatting to color-code each SKU’s recommended safety stock (e.g., green = within range, red = unusually high).
- Sanity-check and update. Flag any safety stock value greater than three times their average daily demand. Schedule a monthly refresh (or sooner if lead-time variability shifts by > 20 %) to keep your buffers accurate.
Old-school doesn’t necessarily mean outdated. However, in this case, it does mean a lot of work.
So I bet you're glad we have two more options on the list. I can assure you: things will get better and less challenging from here.
This safety stock calculator we made
Because we’re always generous around here at The Retail Exec, we went ahead and built you a user-friendly safety stock calculator.
It’s a solid step up from guesswork and spreadsheets. It’s quick, reliable, and handy whenever struggling with finding the right safety stock numbers.
Don't forget to bookmark for future use.
Really great inventory software (the obvious choice)
If you’re looking for accuracy, reliability, and convenience, nothing beats inventory management software.
Here are a few reasons it should be your go-to solution for safety stock calculation:
- Real‑time data sync. Inventory management software collects relevant data for you, eliminating the need to enter it yourself. This includes real-time sales velocity, supplier lead times, return rates, historical demand spikes, and even seasonal trends. Thanks to integrations with your POS, warehouse management system (WMS), and ecommerce platform, it gathers the exact data for safety stock calculations.
- Auto recalculations. You already know how important it is to keep safety stock levels up to date. With inventory software, recalculations happen automatically as key inputs change. Rest assured, your numbers stay current without the extra work.
- Dashboards and alerts. Safety stock is essential for calculating reorder points (ROP), the inventory level that indicates it’s time to restock. Good IMS platforms tie everything together: tracking service-level KPIs, sending low-stock alerts, and surfacing reorder triggers before you’re in trouble.
If you’re looking for a reliable platform, check out these options:


Since safety stock plays a direct role in calculating reorder points, replenishment tools help automate the when and how much to reorder.
Fortunately, there are dedicated inventory replenishment solutions that allow you to maintain the right stock levels at all times.
These are:
Safety Stock Calculation Dos and Don'ts
Before you implement your safety stock strategy, here’s a final gift: A cheat sheet to help you avoid the common pitfalls that can either bloat or deplete your stocks too soon.
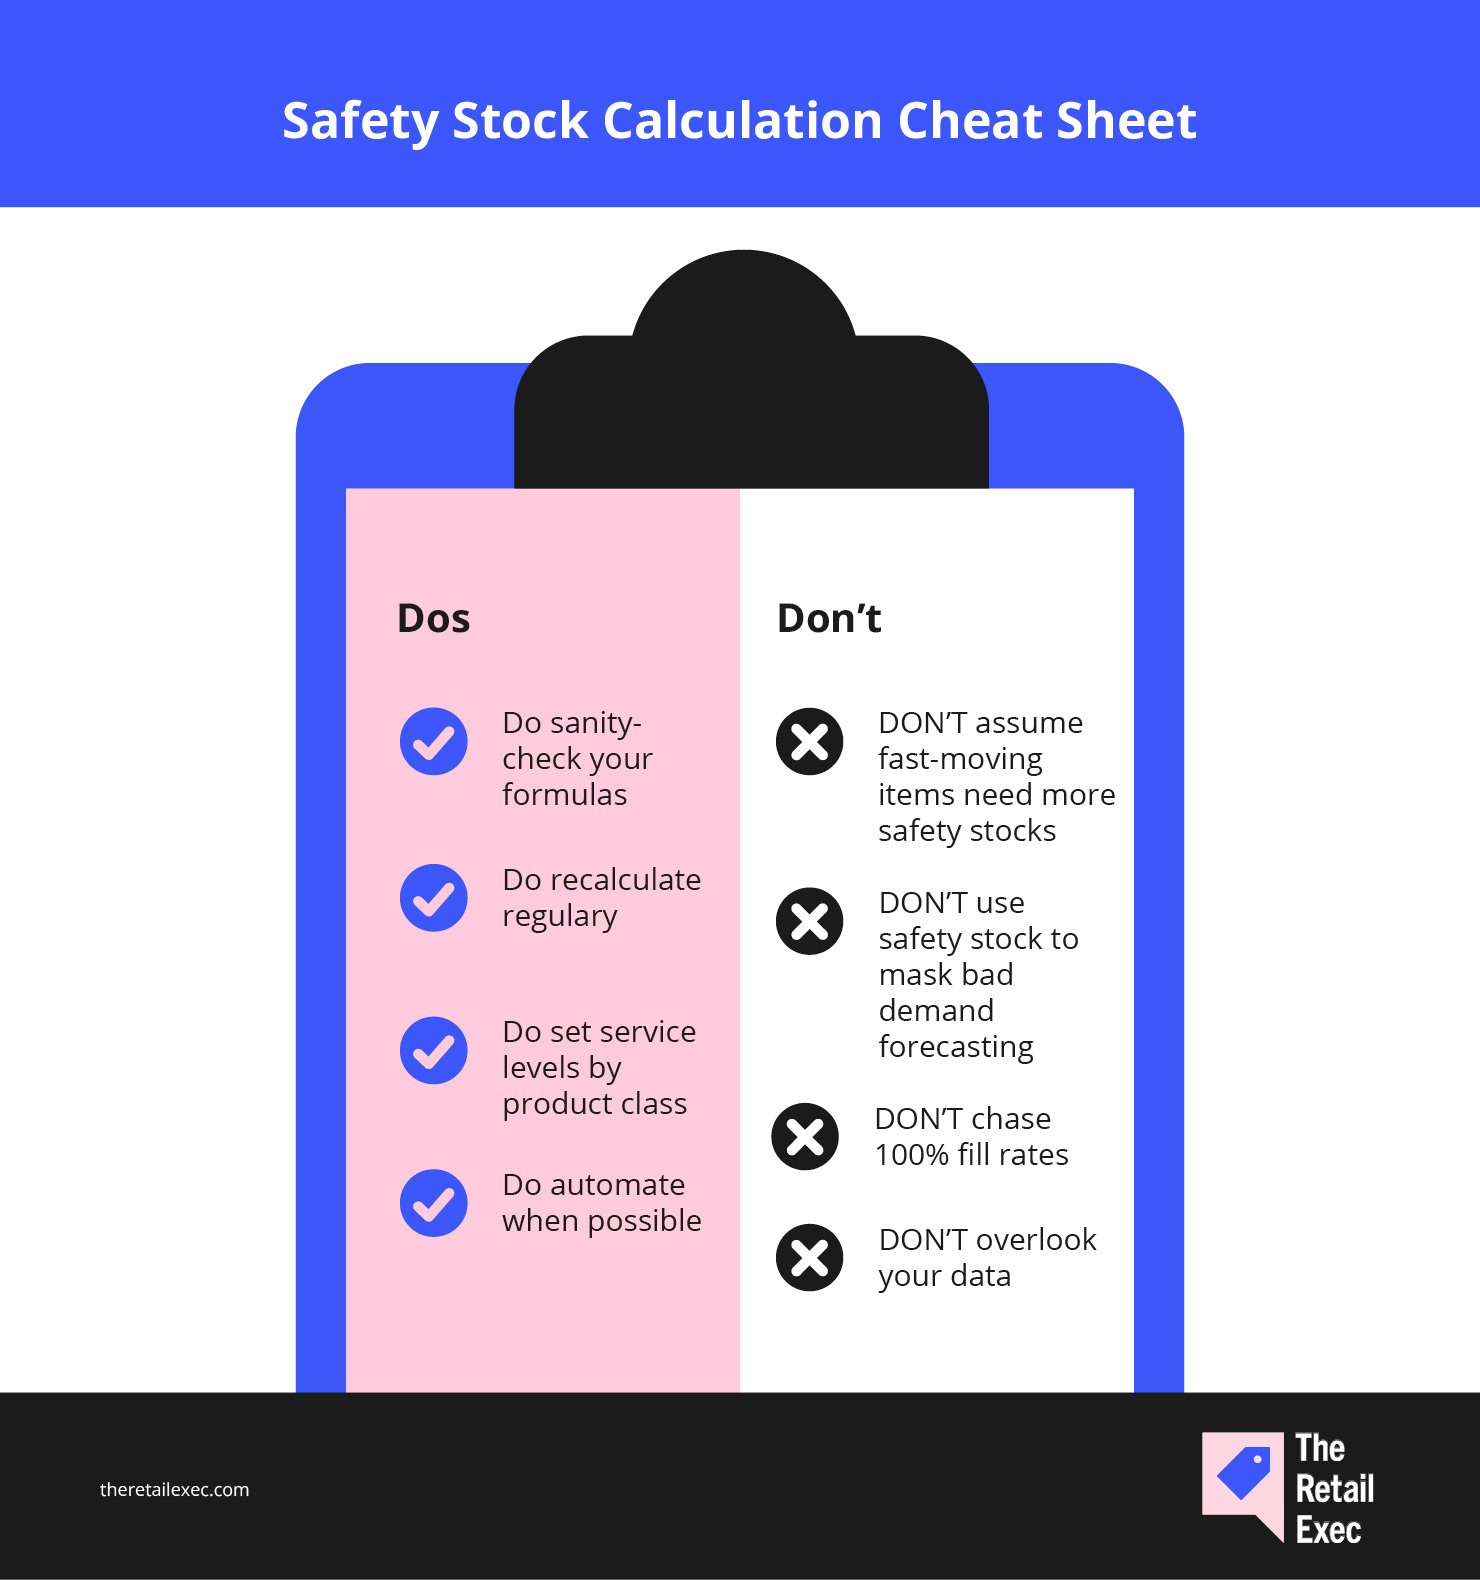
Dos
- DO sanity-check your formulas. If a result seems off, check your inputs first. Common mistakes include incorrect Z-scores, mismatched time units, or outdated standard deviations.
- DO recalculate regularly. Update your calculation during demand spikes, product launches, discontinuations, or SKU portfolio changes.
- DO set service levels by product class. Not all SKUs need 99%. Prioritize high-demand, high-margin SKUs—and keep it lean for slower movers.
- DO automate where possible. Investing in inventory management software allows you to track real-time stock updates, catch formula errors, and adjust buffer quantity as demand or lead times fluctuate.
Don’ts
- DON’T assume fast-moving items need more safety stock. Velocity doesn’t always equal volatility. High-selling SKUs with predictable patterns may not require large buffers.
- DON’T use safety stock to mask bad demand forecasting. If demand planning is broken, padding inventory won’t fix it. Get to the root of the issue.
- DON’T chase 100% fill rates. That last 1% of service isn’t worth a warehouse full of unsold goods and higher holding costs.
- DON’T overlook your data. You can calculate safety stock early on. But as volume grows and variability creeps in, you won’t get optimal safety stocks without accurate historical data.
With the right practices, smart automation, and a healthy respect for your data, you’ll bypass the traps that leave shelves bare or overflowing.
Exactly what you need for better supply chain management.
Stay Safe and Ready to Replenish Whenever Necessary
Safety stock levels influence your inventory control.
This is the best place to look if your business has overstocking or understocking issues. The right tool can help you achieve the right numbers in real-time.
You might be interested in reading the following related topics:
- Perishable Inventory Management: 8 Successful Strategies
- The Real Cost of Inventory Management Challenges (And How to Beat Them)
- Just-in-Time Inventory (JIT): The Complete Guide to Responsive Operations
- The Top 11 Inventory Reduction Strategies for Ecommerce Success 12 Must-Have Inventory Management Software Features (+ Bonus Buyer's Guide)
Retail never stands still—and neither should you. Subscribe to our newsletter for the latest insights, strategies, and career resources from top retail leaders shaping the industry.
Safety Stock FAQs
Let’s clarify a few of the most common questions to help you better handle your safety stock calculation.
What’s the best data range for calculating demand variability?
It’s best to use a data range that accurately reflects typical demand patterns while accounting for seasonal fluctuations, promotions, or unusual spikes.
A 12-month period is a solid starting point. But in fast-moving industries, a 3-6 month range could be more appropriate to capture shorter-term demand shifts.
How does safety stock connect to reorder points?
Safety stock buffers against supply or demand variability, while the reorder point (ROP) signals when to reorder. The ROP formula factors in the amount of safety stock to ensure timely replenishment.
What’s the difference between safety stock and EOQ?
Safety stock is the extra inventory kept to protect against fluctuations in demand or supply disruptions. Meanwhile, economic order quantity (EOQ) is the optimal order quantity that minimizes total inventory costs (ordering and holding costs).
While safety stock is your backup plan for surprises, EOQ is the strategy to keep your orders efficient and cost-effective.

