15 Looker Alternatives Picked for 2026 With Top Features and Use Cases

Looker Alternatives Shortlist
Here’s my shortlist of Looker alternatives:


A strong Looker alternative gives your team flexible data modeling, intuitive dashboards, and reliable integration with your existing data sources. If you’re searching for the best Looker alternatives, you’re likely weighing cost, ease of use, scalability, or specific analytics features that better fit your business.
With so many BI platforms available, it’s tough to know which tools will actually support your reporting, collaboration, and data exploration needs. This list will help you quickly compare the top Looker alternatives for 2026, so you can find the right analytics solution for your team’s goals and workflows.
What Is Looker?
Looker is a business intelligence tool that helps teams explore, analyze, and share real-time data insights. It connects to multiple data sources and uses a modeling language called LookML to create custom reports and dashboards. Looker is often used by data teams, analysts, and business users who need advanced analytics capabilities to visualize trends, monitor KPIs, and support better decisions across the organization. While it offers strong analytics capabilities, some teams find the learning curve steeper than other tools, with a more drag-and-drop interface or more user-friendly visualization tools.
Best Looker Alternatives Summary
This comparison chart summarizes pricing details for my top Looker alternative selections to help you find the best one for your budget and business needs.
| Tool | Best For | Trial Info | Price | ||
|---|---|---|---|---|---|
| 1 | Best for interactive visual analytics | Free trial available | From $75/user/month (billed annually) | Website | |
| 2 | Best for cloud data integration | 30-day free trial + free demo available | Pricing upon request | Website | |
| 3 | Best for in-app analytics features | Free demo available | Pricing upon request | Website | |
| 4 | Best for automated data reporting | 14-day free trial + free demo available | From $800/10 users/month (billed biennially) | Website | |
| 5 | Best with Microsoft 365 integration | Free plan available | From $14/user/month (billed annually) | Website | |
| 6 | Best for real-time KPI dashboards | 14-day free trial + free demo available | From $159/month (billed annually) | Website | |
| 7 | Best for open-source customization | 14-day free trial + free plan + free demo available | From $100/month + $6/user/month | Website | |
| 8 | Best for embedded analytics in apps | 7-day free trial available | From $399/month | Website | |
| 9 | Best for search-driven insights | 14-day free trial + free demo available | From $25/user/month (billed annually) | Website | |
| 10 | Best for self-hosted deployments | Free demo available | Pricing upon request | Website |
Why Trust Our Software Reviews
Looker Alternatives Reviews
Below are my detailed summaries of the Looker alternatives that made it onto my shortlist. My reviews offer a detailed look at the features, best use cases, and integrations of each platform to help you find the best one for your business.
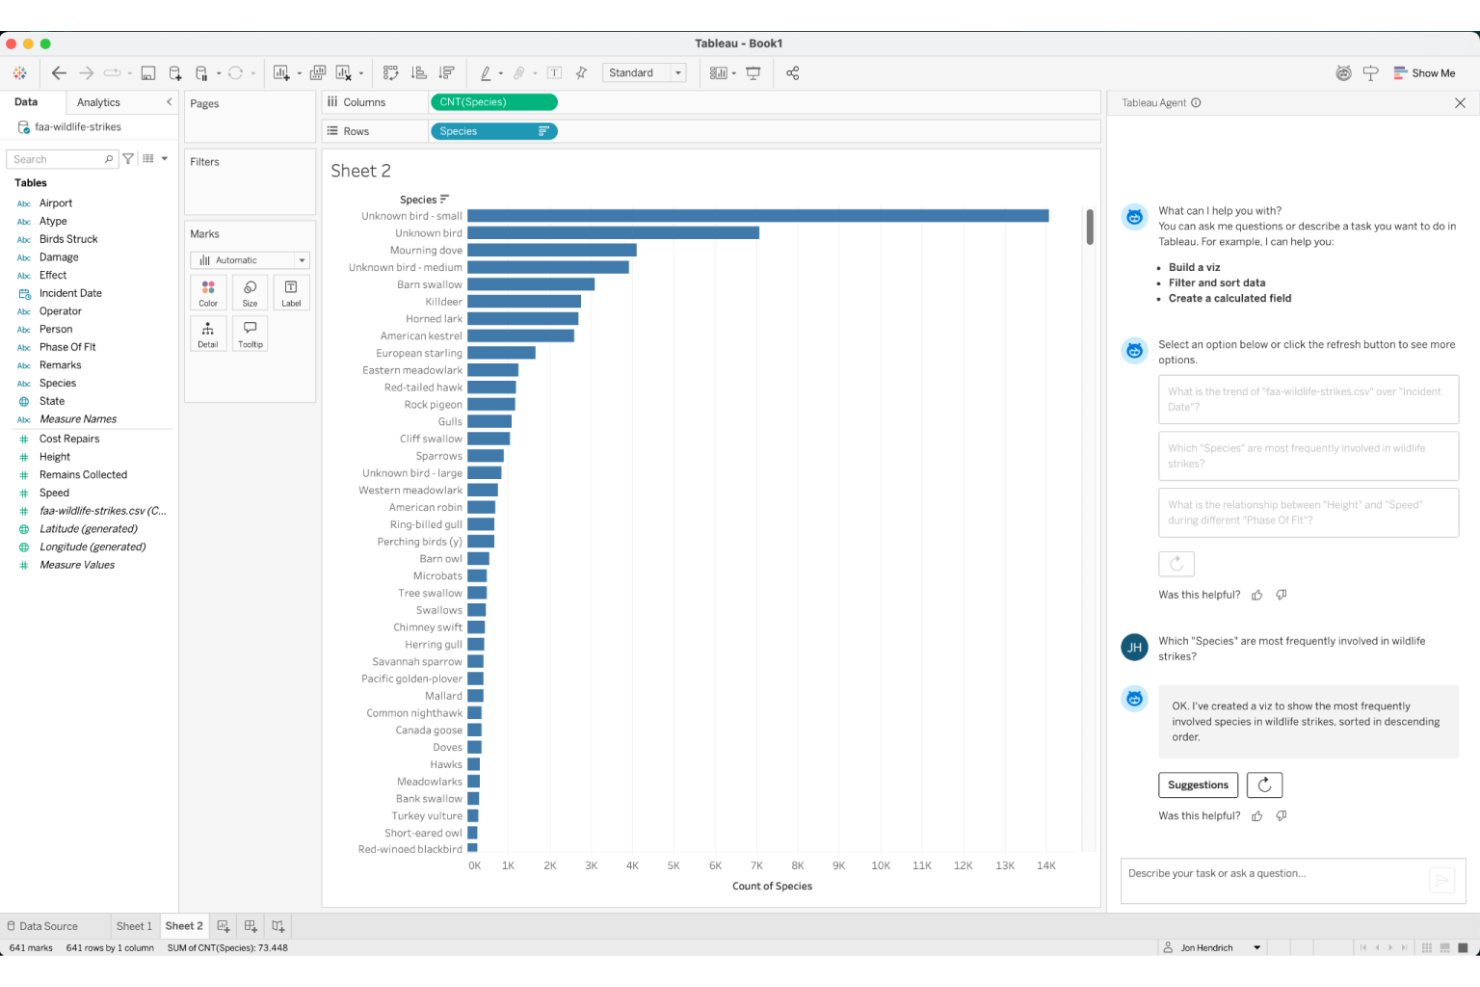
Tableau stands out for teams that need highly interactive and visually rich analytics. It’s a strong fit for retail, ecommerce, and operations professionals who want to dig into data trends and build custom dashboards without heavy coding. If you’re looking for flexible, drag-and-drop visualizations and fast data exploration, Tableau offers a different approach than Looker’s modeling-first workflow.
Why Tableau Is a Good Looker Alternative
Tableau’s strength in interactive visual analytics makes it a compelling choice for teams that want to explore data visually and uncover insights quickly. I picked Tableau because its drag-and-drop dashboard builder and dynamic filtering tools let users manipulate data in real time, which is ideal for retail and ecommerce teams tracking fast-changing metrics. The platform’s wide range of chart types and mapping capabilities also support deep, visual storytelling with your data. If you need to present complex information in a way that’s easy to understand and act on, Tableau offers a different experience than Looker’s code-based approach.
Tableau Key Features
Some other features in Tableau that may interest your team include:
- Data Prep with Tableau Prep: Prepare, clean, and shape your data visually before analysis using Tableau Prep’s workflow interface.
- Scheduled Data Refreshes: Set up automatic data refreshes to keep dashboards and reports up to date with the latest information.
- Row-Level Security: Control access to sensitive data by setting permissions at the row level for different users or groups.
- Mobile-Optimized Dashboards: Build dashboards that automatically adjust for mobile devices, so users can access insights on the go.
Tableau Integrations
Integrations include Salesforce, Google Analytics, Amazon Redshift, Microsoft Excel, Snowflake, Google BigQuery, Oracle, SAP, MySQL, and PostgreSQL.
Pros and Cons
Pros:
- Supports blending online and offline data for holistic analysis
- Offers advanced data visualization and dashboard customization options
- Connects to a wide range of data sources beyond web analytics
Cons:
- Lacks built-in marketing attribution modeling found in some analytics tools
- Requires a separate setup for website tracking compared to Google Analytics
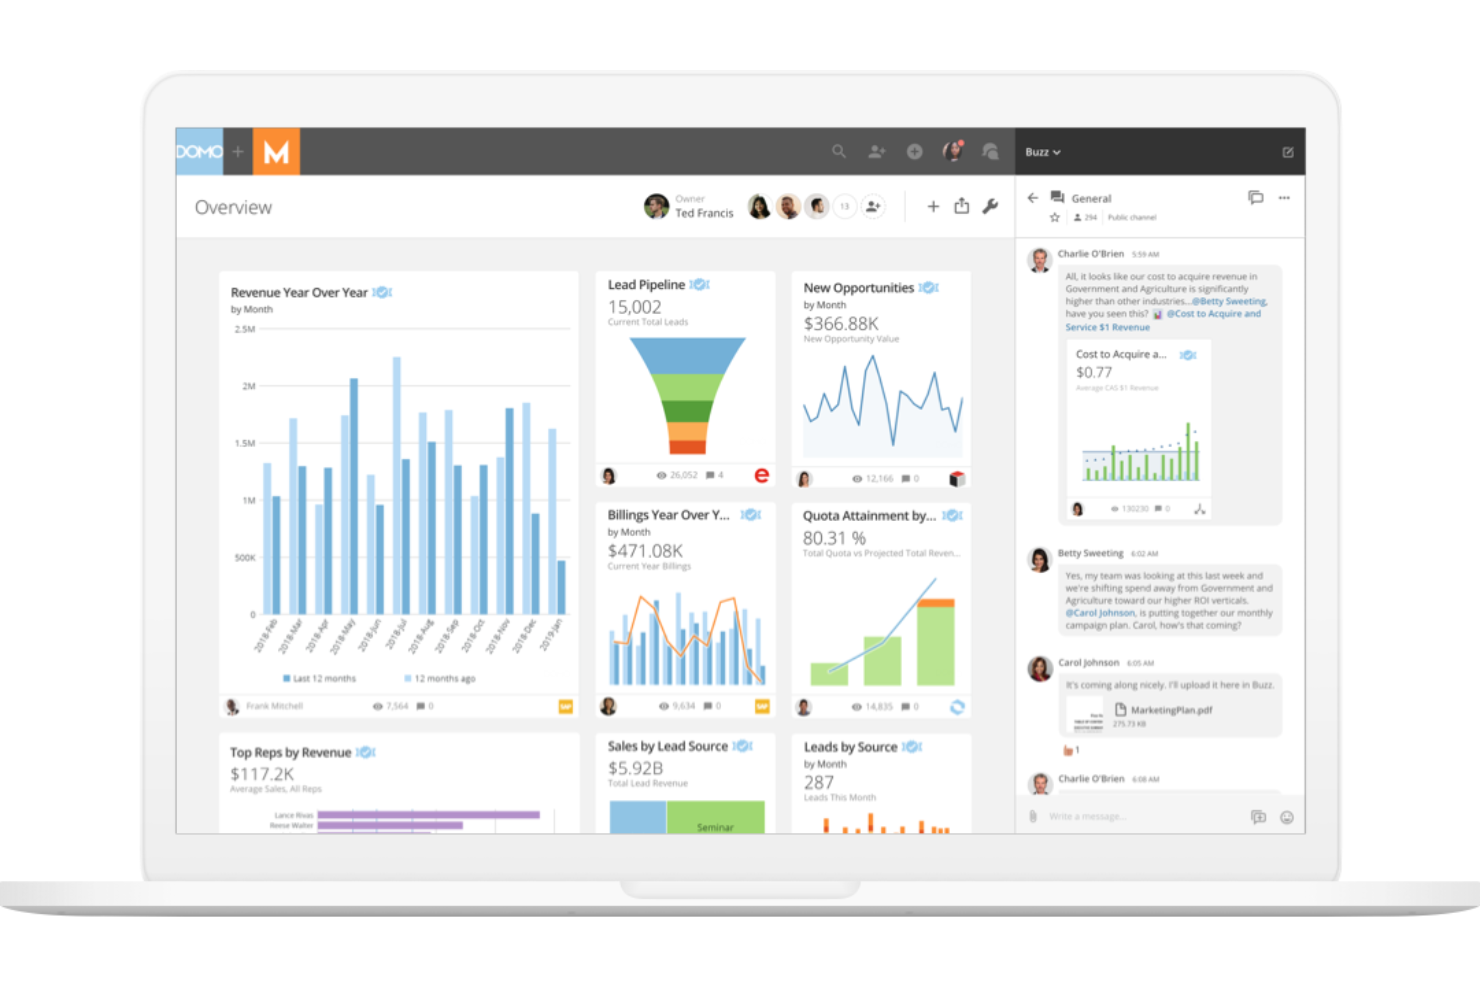
Domo is designed for businesses that need to connect, transform, and analyze data from a wide range of cloud sources. Retail, ecommerce, and operations teams often choose Domo for its ability to unify data pipelines and automate workflows across multiple platforms. Unlike Looker, Domo emphasizes cloud-native integration and real-time data sharing, making it easier to centralize insights from scattered systems.
Why Domo Is a Good Looker Alternative
If your business relies on connecting data from dozens of cloud platforms, Domo offers a unique advantage over Looker. I picked Domo because its cloud-native architecture lets you pull, blend, and analyze data from sources like AWS, Google Cloud, and Salesforce without heavy IT involvement. Domo’s Magic ETL feature allows you to visually transform and prepare data directly in the platform, so you can automate complex workflows and keep your analytics up to date. For teams that need to centralize and act on cloud data quickly, Domo’s integration capabilities are hard to match.
Domo Key Features
Some other features that make Domo appealing include:
- App Studio: Build and deploy custom data apps directly within the platform.
- Data Governance Tools: Manage user permissions, data access, and compliance controls.
- Alerting and Notifications: Set up automated alerts for key metric changes or anomalies.
- Embedded Analytics: Integrate Domo dashboards and reports into external websites or applications.
Domo Integrations
Integrations include Salesforce, Google Analytics, Facebook Ads, Twitter, Instagram, Shopify, HubSpot, Marketo, LinkedIn, and Microsoft Dynamics.
Pros and Cons
Pros:
- App Studio allows building custom data apps within the platform
- Magic ETL enables visual data transformation without coding skills
- Cloud-native data integration supports real-time connections to many sources
Cons:
- Initial setup and data ingestion may require vendor assistance
- Large data volumes can lead to slower dashboard performance
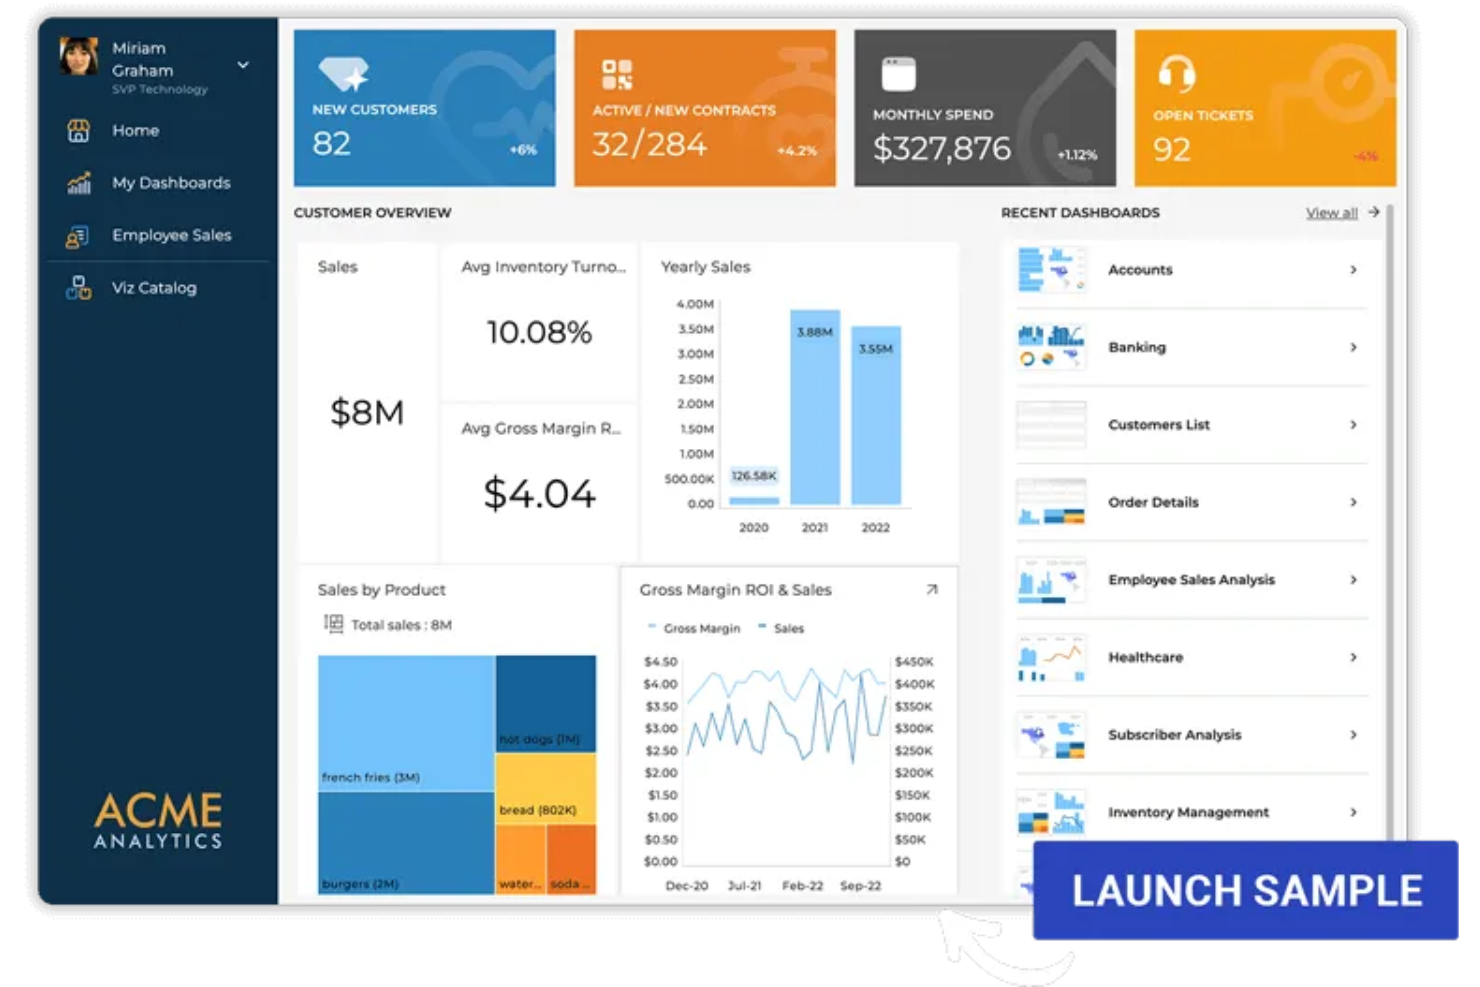
Reveal is built for product teams and software companies that want to embed analytics directly into their own applications. If you need to deliver interactive dashboards and data visualizations inside your product, Reveal offers flexible SDKs and white-labeling options that Looker doesn’t. This approach helps you give end users real-time insights without sending them to a separate analytics platform.
Why Reveal Is a Good Looker Alternative
Unlike Looker, Reveal is purpose-built for embedding analytics directly into your own software products. I picked Reveal because its SDKs let you add interactive dashboards, charts, and data visualizations right inside your application, so users never have to leave your platform to access insights. Reveal also supports white-labeling, which means you can fully brand the analytics experience as your own. For teams focused on delivering in-app analytics, Reveal offers a level of flexibility and control that Looker doesn’t match.
Reveal Key Features
Some other features that make Reveal appealing include:
- Data Source Connectivity: Connect to a wide range of databases, cloud services, and spreadsheets.
- Role-Based Access Control: Set user permissions to manage who can view or edit analytics content.
- Scheduled Reporting: Automate the delivery of reports to users on a recurring schedule.
- Mobile-Optimized Dashboards: Access and interact with analytics dashboards from any mobile device.
Reveal Integrations
Integrations include PostgreSQL, MySQL, BigQuery, Snowflake, Databricks, Google Sheets, REST, JSON, Excel, and other supported data sources through Reveal SDK connectors.
Pros and Cons
Pros:
- Mobile-optimized dashboards provide responsive analytics on any device
- White-labeling options allow full branding of analytics experiences
- Embeddable analytics SDKs support integration into custom applications
Cons:
- Limited documentation for complex integration scenarios
- Fewer advanced data modeling features compared to Looker
Holistics is designed for teams that want to automate data reporting and reduce manual analytics work. It’s especially useful for ecommerce and retail operations that need to deliver recurring, scheduled reports to multiple stakeholders. Unlike Looker, Holistics emphasizes code-based data modeling and automated report delivery, making it a strong fit for data-driven teams with ongoing reporting needs.
Why Holistics Is a Good Looker Alternative
If you’re looking for a business intelligence platform that prioritizes automated data reporting, Holistics is worth considering. I picked Holistics because it lets you schedule and deliver recurring reports directly to email, Slack, or other channels without manual intervention. The platform’s data modeling layer uses code, so you can define reusable logic and automate complex reporting workflows. For teams that need to keep stakeholders updated with fresh data regularly, Holistics offers automation capabilities that go beyond what Looker provides out of the box.
Holistics Key Features
Some other features that make Holistics appealing include:
- Self-Service Data Exploration: Let users explore and visualize data without writing SQL.
- Version Control Integration: Manage data models and changes using Git-based workflows.
- Row-Level Security: Restrict data access based on user roles and permissions.
- Data Transformation Pipelines: Build and schedule data transformation jobs directly within the platform.
Holistics Integrations
Integrations include Snowflake, Google BigQuery, Amazon Redshift, MySQL, PostgreSQL, Amazon Athena, ClickHouse, Presto, SQL Server, and Databricks.
Pros and Cons
Pros:
- Built-in data connectors reduces need to connect to multiple databases
- Centralized data logic improves reporting consistency
- SQL-based modeling supports complex data workflows
Cons:
- Advanced dashboard interactivity features are not as fully developed
- Documentation and community resources are less mature than Looker’s
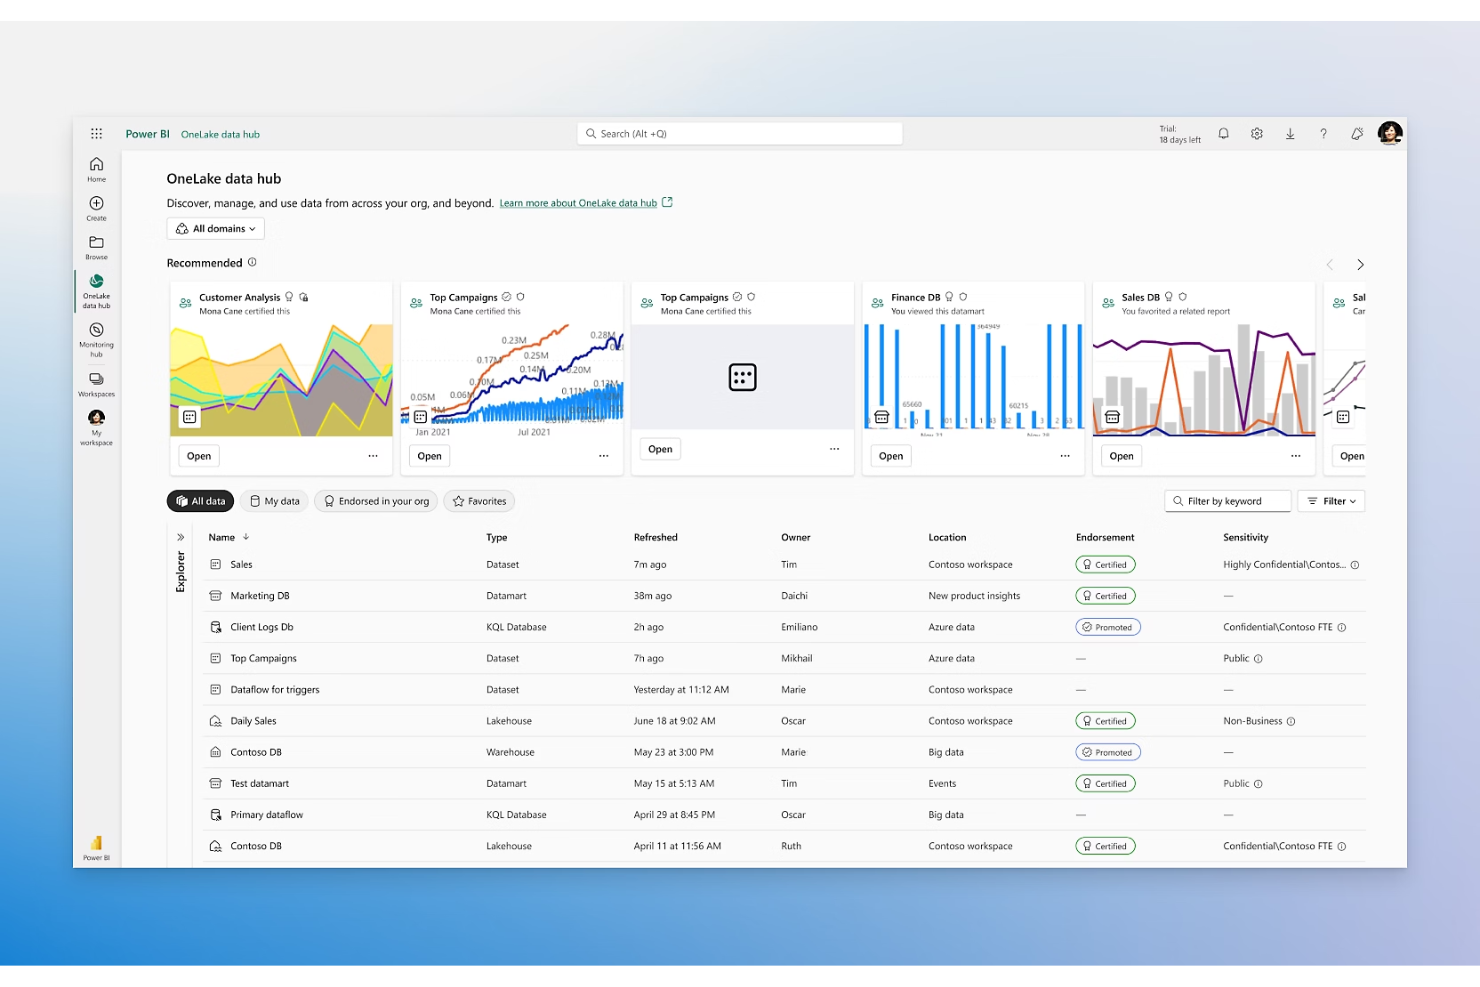
If your business already relies on Microsoft 365, Power BI offers a natural extension for analytics and reporting. It’s especially useful for retail and ecommerce teams that want to connect Excel, Teams, and SharePoint data for unified dashboards. Power BI stands out from Looker by providing deep integration with Microsoft’s productivity tools and familiar interfaces for users across your organization.
Why Microsoft Power BI Is a Good Looker Alternative
For teams already invested in Microsoft 365, Power BI offers analytics that fit right into your existing workflows. I picked Power BI because it lets you pull data directly from Excel, Teams, and SharePoint, making it easy to build dashboards with the tools your business already uses. Its integration with Microsoft 365 also means you can collaborate on reports and share insights within familiar apps. If you want analytics that feel like a natural part of your Microsoft environment, Power BI delivers a different experience than Looker’s standalone platform.
Microsoft Power BI Key Features
Some other features in Power BI that may be useful for your team include:
- AI-Powered Data Insights: Use built-in artificial intelligence to detect patterns and generate insights from your data.
- Custom Visual Marketplace: Access a library of custom visuals created by Microsoft and the Power BI community to enhance your reports.
- Data Gateway Support: Connect on-premises data sources securely to your Power BI dashboards using Microsoft’s data gateway.
- Paginated Reports: Create pixel-perfect, print-ready reports for operational and regulatory needs.
Microsoft Power BI Integrations
Integrations include Microsoft Excel, Microsoft Teams, SharePoint, PowerPoint, Outlook, Microsoft Azure, Dynamics 365, OneDrive, Microsoft Dataverse, and Microsoft Purview.
Pros and Cons
Pros:
- Large library of custom visuals for dashboards
- Natural language queries simplify data exploration
- Strong compatibility with Microsoft 365 workflows
Cons:
- Gateway configuration needed for on-premises data access
- Complex licensing structure for advanced capabilities
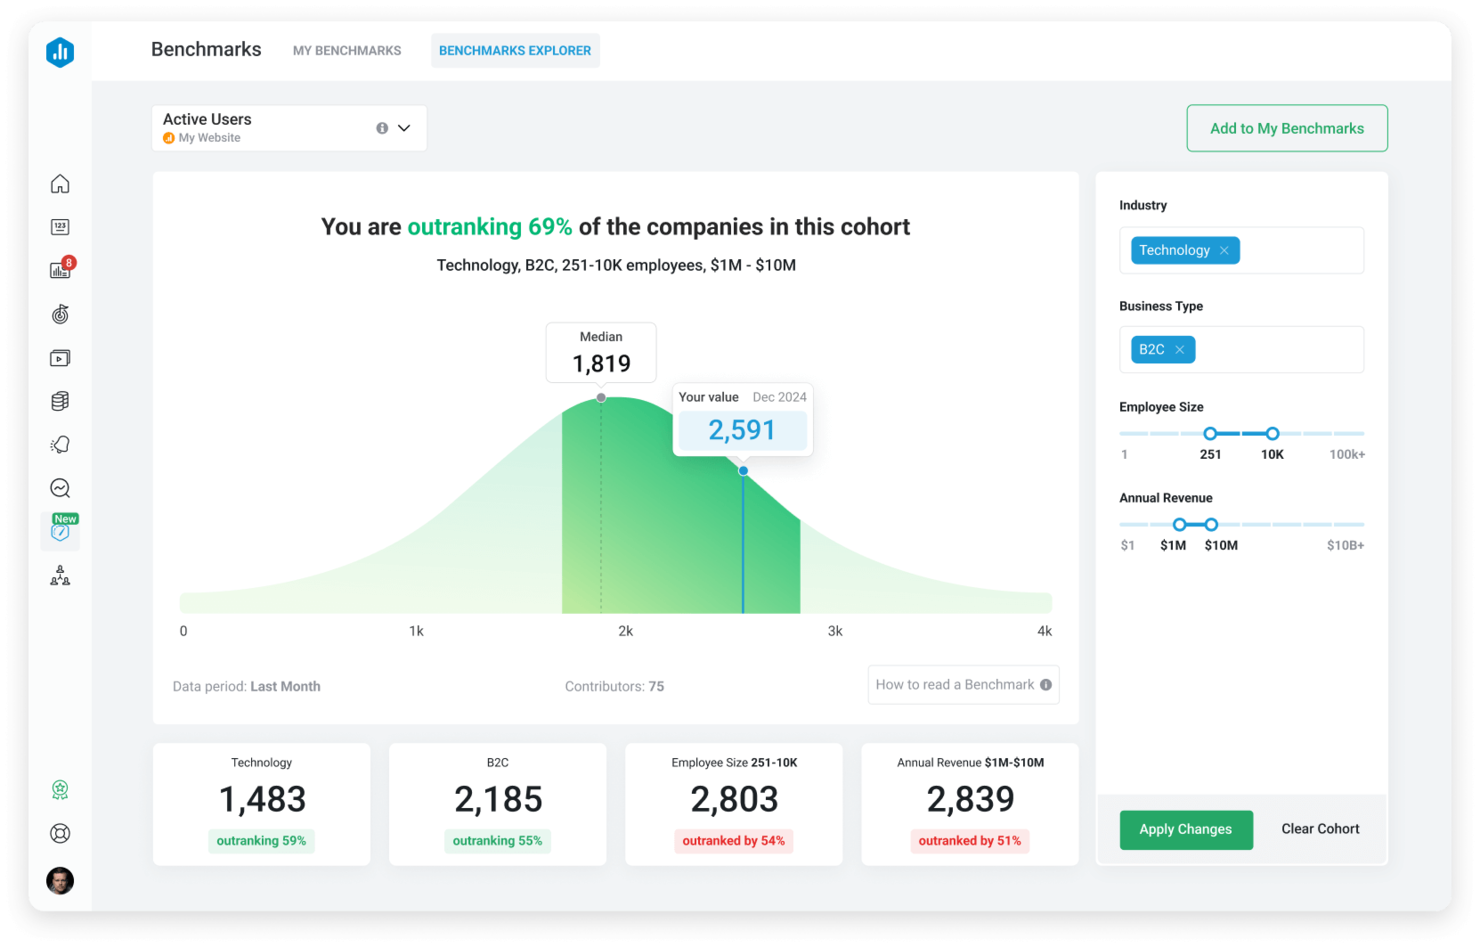
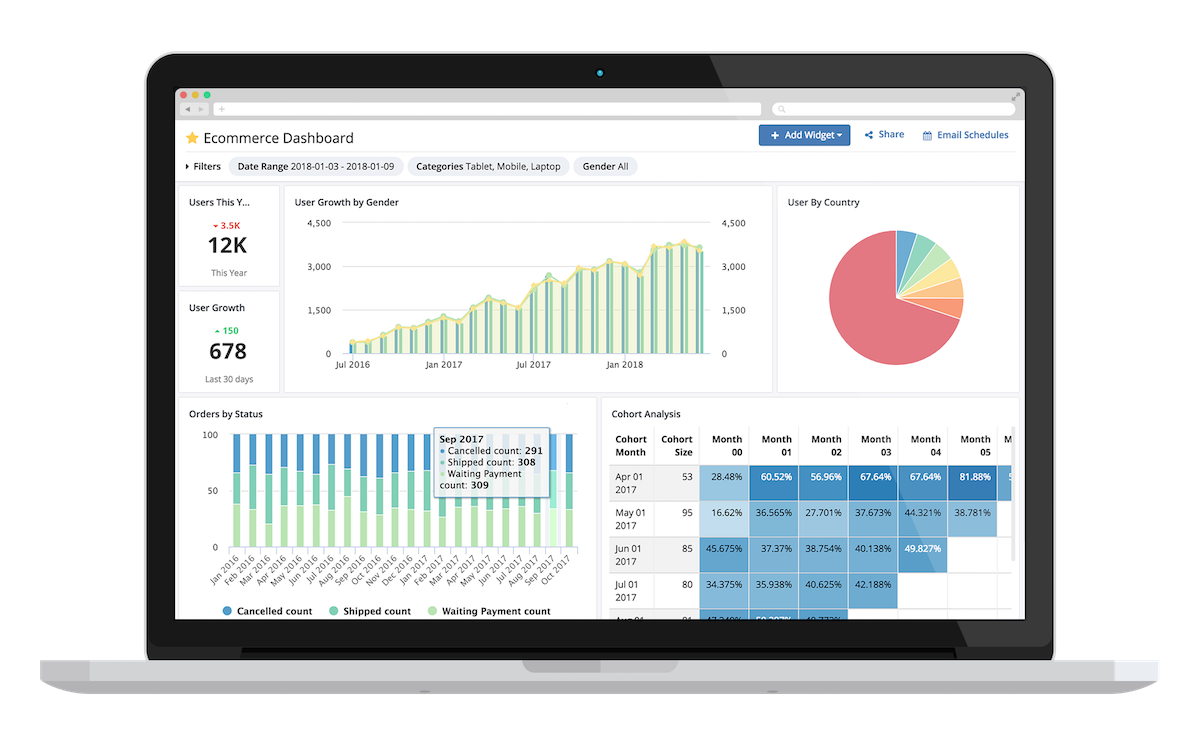
Databox is built for teams that need real-time visibility into key performance indicators across multiple data sources. It’s especially useful for ecommerce, retail, and marketing professionals who want to monitor live metrics and spot trends as they happen. Unlike Looker, Databox focuses on rapid dashboard creation and instant data syncing, making it easier to keep a pulse on business performance without waiting for scheduled reports.
Why Databox Is a Good Looker Alternative
For teams that need up-to-the-minute insights, Databox stands out with its real-time KPI dashboards. I picked Databox because it lets you connect dozens of data sources and see live updates on a single dashboard, so you never have to wait for scheduled refreshes. The platform’s drag-and-drop dashboard builder makes it simple to visualize and track metrics as they change throughout the day. If you want to monitor business performance in real time, Databox offers a level of immediacy that Looker doesn’t match.
Databox Key Features
Some other features that make Databox appealing include:
- Goal Tracking: Set, monitor, and visualize progress toward specific business goals.
- Mobile App Access: View dashboards and receive alerts on iOS and Android devices.
- Data Calculations: Create custom metrics by combining data from multiple sources.
- Scheduled Snapshots: Automatically send dashboard snapshots to your team via email or Slack.
Databox Integrations
Integrations include Google Analytics, HubSpot, Facebook Ads, Shopify, Instagram Business, LinkedIn, X Ads, Salesforce, Mailchimp, QuickBooks, and more.
Pros and Cons
Pros:
- Mobile app access allows users to monitor KPIs on the go
- Pre-built connectors simplify integration with popular marketing and sales tools
- Real-time dashboard updates support immediate decision-making for teams
Cons:
- Data transformation options are limited compared to Looker’s modeling layer
- Custom SQL querying is not supported for advanced data analysis
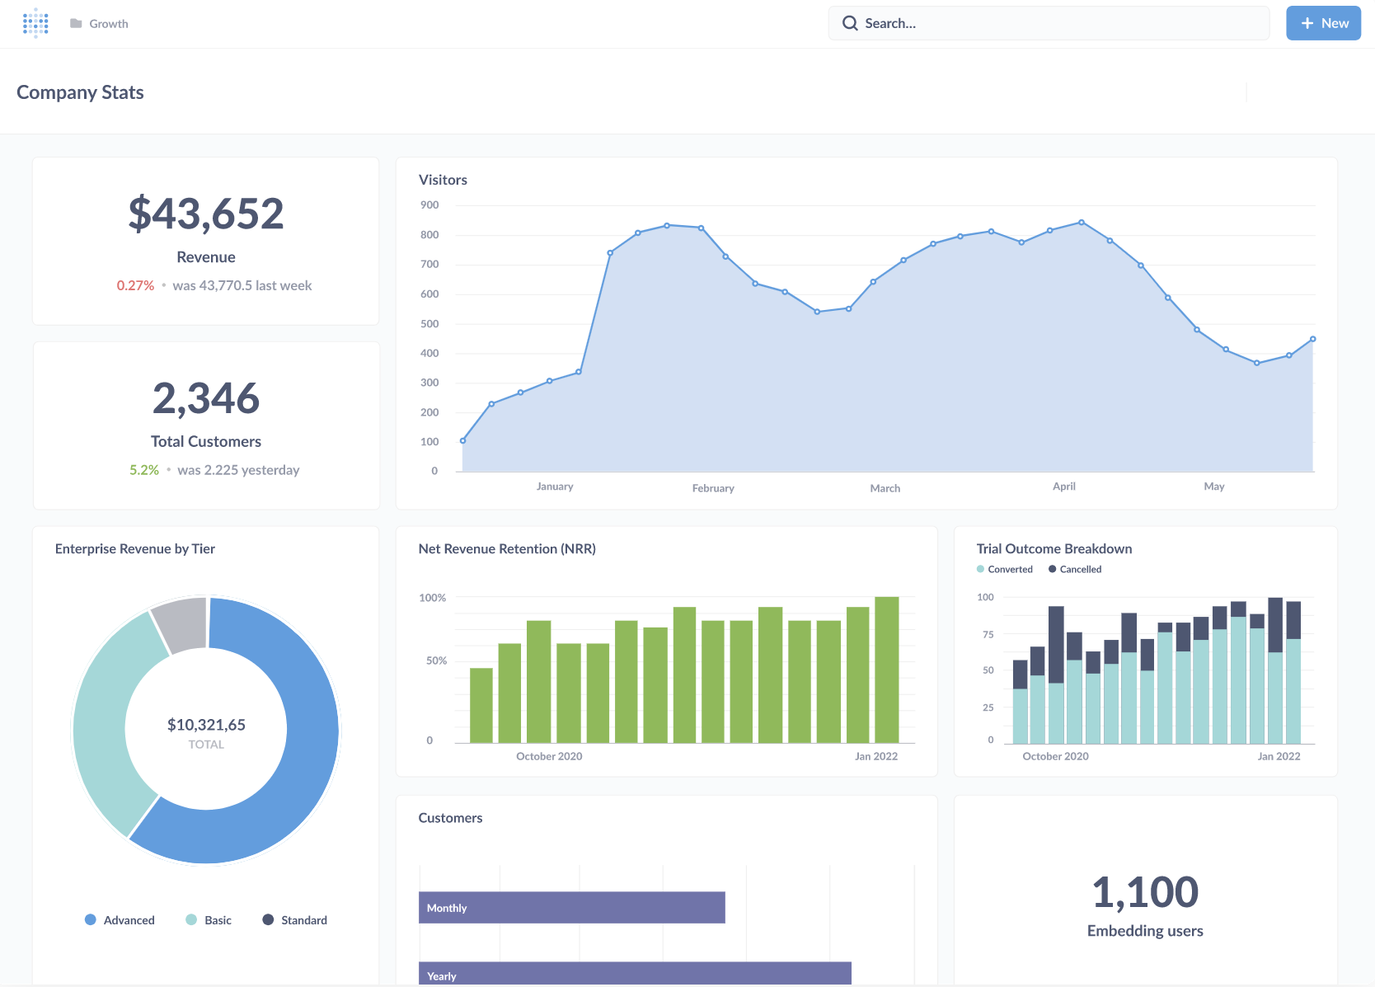
For teams that want full control over their analytics environment, Metabase offers an open-source platform built for customization. It’s a strong fit for retail and ecommerce businesses with in-house technical talent who want to tailor dashboards, queries, and workflows to their exact needs. Unlike Looker, Metabase gives you direct access to the source code, so you can adapt the platform as your data strategy evolves.
Why Metabase Is a Good Looker Alternative
If your team wants to customize every aspect of your analytics stack, Metabase stands out for its open-source flexibility. I picked Metabase because you can modify the source code, build custom visualizations, and even create your own plugins to fit unique business needs. The platform supports advanced SQL queries and lets you embed analytics directly into your own applications. For organizations that want to own and adapt their BI environment, Metabase offers a level of control that Looker doesn’t match.
Metabase Key Features
Some other features that make Metabase appealing include:
- No-Code Query Builder: Build complex queries using a visual interface without writing SQL.
- Automated Report Scheduling: Schedule recurring reports to be delivered via email or Slack.
- Interactive Dashboards: Create dashboards with filters, drill-downs, and dynamic visualizations.
- Audit Logs: Track user activity and changes within the platform for compliance and security.
Metabase Integrations
Integrations include Exasol, Cube, Databricks, Dremio, Druid, DuckDB, Firebolt, Google Sheets, Hydra, MariaDB, Snowflake, and more.
Pros and Cons
Pros:
- Embeddable analytics let you add dashboards to your own apps
- Supports direct SQL queries for advanced data exploration needs
- Open-source codebase allows full customization and self-hosting options
Cons:
- Fewer advanced visualization types compared to some competitors
- Limited built-in support for row-level security and granular permissions
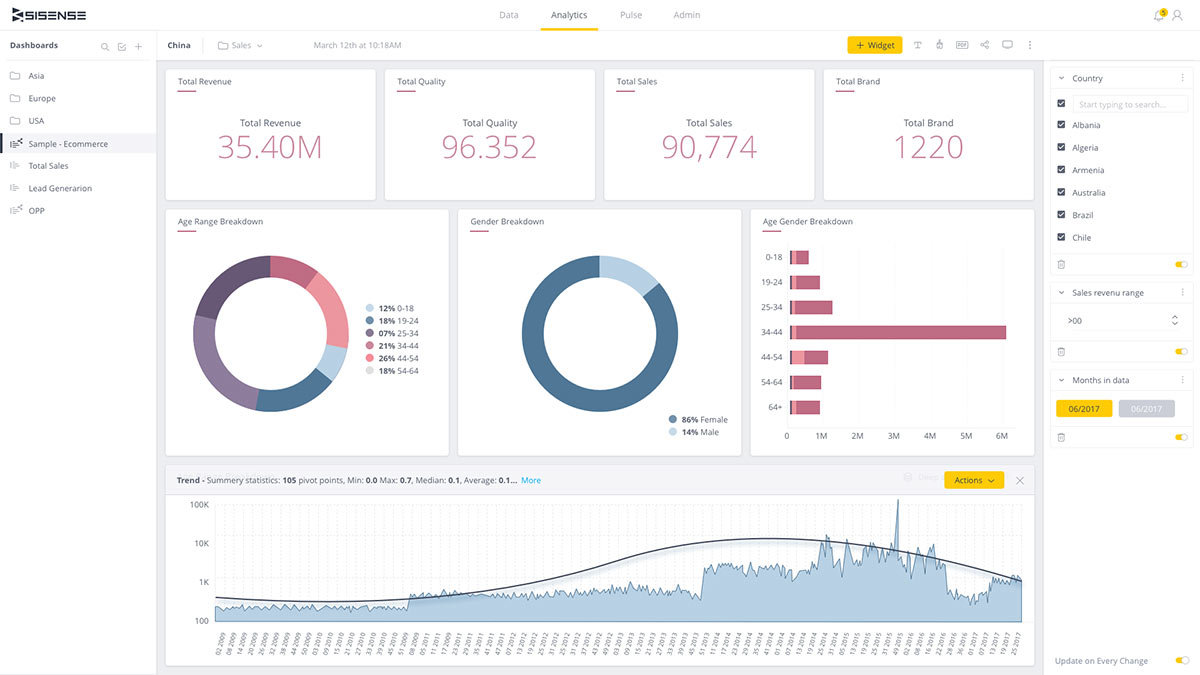
If you need to embed analytics directly into your own products or customer-facing apps, Sisense is built for that purpose. This platform is a strong fit for software companies, SaaS providers, and digital teams that want to deliver interactive dashboards and analytics within their own user experiences. Sisense stands apart from Looker by offering flexible APIs and white-labeling options that let you fully control how analytics appear and function inside your applications.
Why Sisense Is a Good Looker Alternative
For teams that want to embed analytics directly into their own products, Sisense offers a level of flexibility that Looker doesn’t match. I picked Sisense because its API-first architecture and white-labeling options let you fully customize the analytics experience for your users. You can control everything from dashboard layout to branding, and even integrate analytics into complex workflows within your app. If you need to deliver analytics as part of your product offering, Sisense gives you the tools to make it feel like a native part of your platform.
Sisense Key Features
Some other features that stood out to me include:
- Elasticube Data Modeling: Build and manage custom data models using Sisense’s in-memory engine.
- Natural Language Query: Let users ask questions in plain language and get instant visualizations.
- Scheduled Reporting: Automate the delivery of dashboards and reports to stakeholders on a set schedule.
- Role-Based Access Control: Set granular permissions for users and groups to manage data security.
Sisense Integrations
Integrations include Snowflake, Google BigQuery, Amazon Redshift, Databricks, Azure Synapse, Salesforce, Oracle, PostgreSQL, MySQL, and SQL Server.
Pros and Cons
Pros:
- Elasticube engine supports complex data modeling and fast querying
- White-labeling options allow full control over dashboard branding
- Embedding analytics into web and mobile apps is highly customizable
Cons:
- Dashboard performance can lag with very large datasets
- Data preparation tools are less intuitive than some competitors
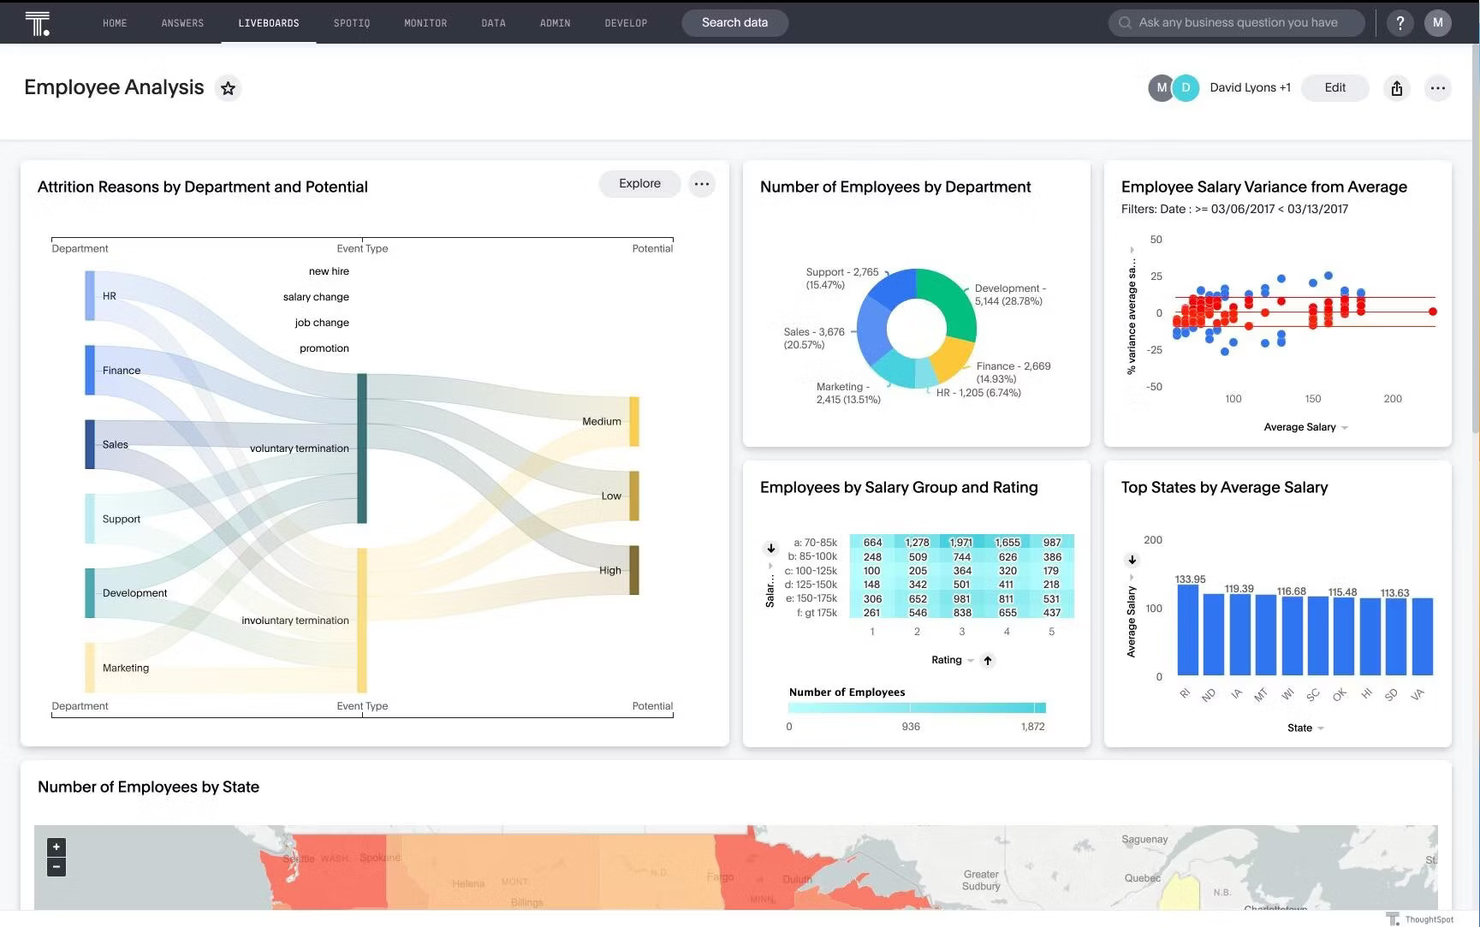
If your team wants to make data exploration as simple as searching online, ThoughtSpot is designed for you. This platform is especially useful for retail, ecommerce, and operations teams that need quick, self-serve answers from complex data without relying on analysts. ThoughtSpot stands out from Looker by letting users type natural language queries and instantly generate interactive reports and visualizations.
Why ThoughtSpot Is a Good Looker Alternative
Unlike traditional BI tools that require building dashboards in advance, ThoughtSpot lets users search for insights using natural language queries. I picked ThoughtSpot because its search-driven analytics engine allows anyone to type a question and instantly see relevant charts, tables, or trends. The platform’s AI-powered suggestions help guide users to the right data, even if they’re not sure where to start. For teams that want fast, flexible answers without waiting for analyst support, ThoughtSpot offers a unique approach that sets it apart from Looker.
ThoughtSpot Key Features
Some other features that caught my attention include:
- Live Analytics on Cloud Data: Query data directly from cloud data warehouses without moving or duplicating it.
- Pinboards: Create and share interactive dashboards that update in real time.
- Data Modeling Layer: Define relationships, hierarchies, and custom metrics within your datasets.
- Granular Access Controls: Set detailed permissions for users, groups, and data sources.
ThoughtSpot Integrations
Integrations include Snowflake, Google BigQuery, Amazon Redshift, Databricks, Microsoft Azure Synapse, Google Sheets, Salesforce, ServiceNow, Oracle, and SAP.
Pros and Cons
Pros:
- AI-driven insights surface trends and anomalies automatically
- Live query capability connects directly to cloud data warehouses
- Natural language search enables fast, self-serve data exploration
Cons:
- Custom visualization choices are limited compared to some competitors
- Data modeling options are less flexible than Looker’s LookML
When you need full control over your analytics infrastructure, Apache Superset offers a self-hosted business intelligence platform built for customization. It’s a strong choice for retail and ecommerce teams with technical resources who want to manage their own data security, compliance, and deployment. Superset stands apart from Looker by giving you the freedom to deploy on your own servers and tailor the environment to your organization’s requirements.
Why Apache Superset Is a Good Looker Alternative
For teams that need to host analytics on their own infrastructure, Apache Superset is purpose-built for self-hosted deployments. I picked Superset because it gives you full control over your data environment, letting you manage security, compliance, and scaling on your own terms. The platform supports custom authentication, granular access controls, and flexible deployment options across cloud or on-premise servers. If your business requires strict data governance or operates in a regulated industry, Superset offers a level of deployment flexibility that Looker doesn’t provide.
Apache Superset Key Features
Some other features that make Superset appealing include:
- Drag-and-Drop Dashboard Builder: Create interactive dashboards using a visual, no-code interface.
- Wide Database Support: Connect natively to databases like PostgreSQL, MySQL, BigQuery, and Snowflake.
- Custom Visualization Plugins: Extend charting capabilities by adding or developing your own plugins.
- SQL Lab: Write, run, and save complex SQL queries directly within the platform.
Apache Superset Integrations
Integrations include PostgreSQL, MySQL, BigQuery, Snowflake, and many other SQL-compatible databases.
Pros and Cons
Pros:
- Flexible deployment options for on-premise or private cloud hosting
- Supports a wide range of SQL-speaking databases natively
- Fully open-source platform with no vendor lock-in concerns
Cons:
- Advanced user permissions require manual configuration and maintenance
- No built-in semantic modeling layer like Looker’s LookML
Other Looker Alternatives
Here are some additional Looker alternatives that didn’t make it onto my shortlist, but are still worth checking out:
- Qlik Sense
For associative data exploration
- Zoho Analytics
For unified business app reporting
- GoodData
For scalable multi-tenant reporting
- Mode
For collaborative data exploration
- Toucan
For guided analytics for business teams


Looker Alternatives Selection Criteria
When selecting the best Looker alternatives to include in this list, I considered common buyer needs and pain points related to business intelligence and data analytics platform products, like blending data from multiple sources and enabling self-service reporting for business users. I also used the following framework to keep my evaluation structured and fair:
Core Functionality (25% of total score) To be considered for inclusion in this list, each solution had to fulfill these common use cases:
- Connect to multiple data sources
- Build interactive dashboards and reports
- Schedule and automate report delivery
- Support data visualization and charting
- Enable user access controls and permissions
Additional Standout Features (25% of total score) To help further narrow down the competition, I also looked for unique features, such as:
- AI-powered insights and natural language queries
- Embedded analytics for external applications
- Advanced data modeling and transformation tools
- White-labeling and custom branding options
- Real-time data sync and streaming analytics
Usability (10% of total score) To get a sense of the usability of each system, I considered the following:
- Intuitive dashboard and report builder
- Clean and modern interface design
- Logical navigation and menu structure
- Responsive performance with large datasets
- Accessibility for non-technical users
Onboarding (10% of total score) To evaluate the onboarding experience for each platform, I considered the following:
- Availability of step-by-step product tours
- Access to training videos and documentation
- Pre-built report and dashboard templates
- Guided setup wizards for data connections
- Live chat or onboarding webinars
Customer Support (10% of total score) To assess each software provider’s customer support services, I considered the following:
- 24/7 support availability
- Multiple support channels,, including chat and phone
- Access to a searchable knowledge base
- Fast response times to inquiries
- Community forums or user groups
Value For Money (10% of total score) To evaluate the value for money of each platform, I considered the following:
- Transparent and flexible pricing plans
- Features included at each pricing tier
- Free trial or free plan availability
- No hidden fees or surprise charges
- Scalability of pricing as usage grows
Customer Reviews (10% of total score) To get a sense of overall customer satisfaction, I considered the following when reading customer reviews:
- Consistency of positive feedback across platforms
- Reported reliability and uptime
- Quality of support and onboarding experiences
- Frequency of feature updates and improvements
- Real-world examples of business impact
Why Look For a Looker Alternative?
While Looker is a strong business intelligence tool, there are several reasons buyers start comparing the best alternatives. You might be looking for a Looker alternative because…
- You want a shorter learning curve for business users and non-technical teams
- You need a more intuitive drag-and-drop interface for dashboard building
- You want more user-friendly visualization tools for faster reporting
- Your team needs advanced features without relying as heavily on technical setup
- You want stronger support for forecasting or easier access to advanced analytics
- You need connections to tools like Google Analytics as part of your reporting workflow
- You want pricing or packaging that works better for growing teams or unlimited users
If any of these sound like you, you’ve come to the right place. This list includes several of the best alternatives to Looker for teams that need flexible analytics capabilities, easier reporting workflows, or a better fit for their business needs.
Looker Key Features
Here are some of the key features of Looker, to help you contrast and compare what alternative solutions offer:
- Centralized data modeling with LookML language
- Customizable dashboards and interactive visualizations
- Scheduled and automated report delivery
- Embedded analytics for external applications
- Row-level security and granular user permissions
- Integration with Google Cloud and BigQuery
- Real-time data exploration and ad hoc querying
- API access for custom workflows and integrations
- Version control for analytics models and dashboards