How Mid-Market Retailers Can Build Retail Media Networks: Beyond Amazon & Walmart


Growth Potential: Retail media spending is projected to grow annually 20% to surpass TV advertising by 2028.
Profit Margins: Retail media networks boast 60-70% profit margins, significantly higher than traditional retail.
Technology Access: Mid-market retailers can now leverage tech partners to launch media networks without large resources.
Revenue Streams: Retail media networks generate income from on-site, off-site, and in-store ad options.
Competitive Advantage: Mid-market retailers can capitalize on niche audience data and existing supplier relationships.
The retail media gold rush isn't just for Amazon and Walmart anymore.
Retailers are moving budget from broad digital advertising into commerce media—audience, ad placements, and measurement built on retailers’ first‑party data—as third‑party cookies fade and performance moves closer to the point of purchase.
In-store retail media ad spending is expected to grow 47% in 2025 and surpass $1 billion by 2028. Global digital retail ad spending is reaching $166 billion in 2025, with retail media growing at 20% year-over-year—nearly five times faster than the overall ad market's 4.3% growth.
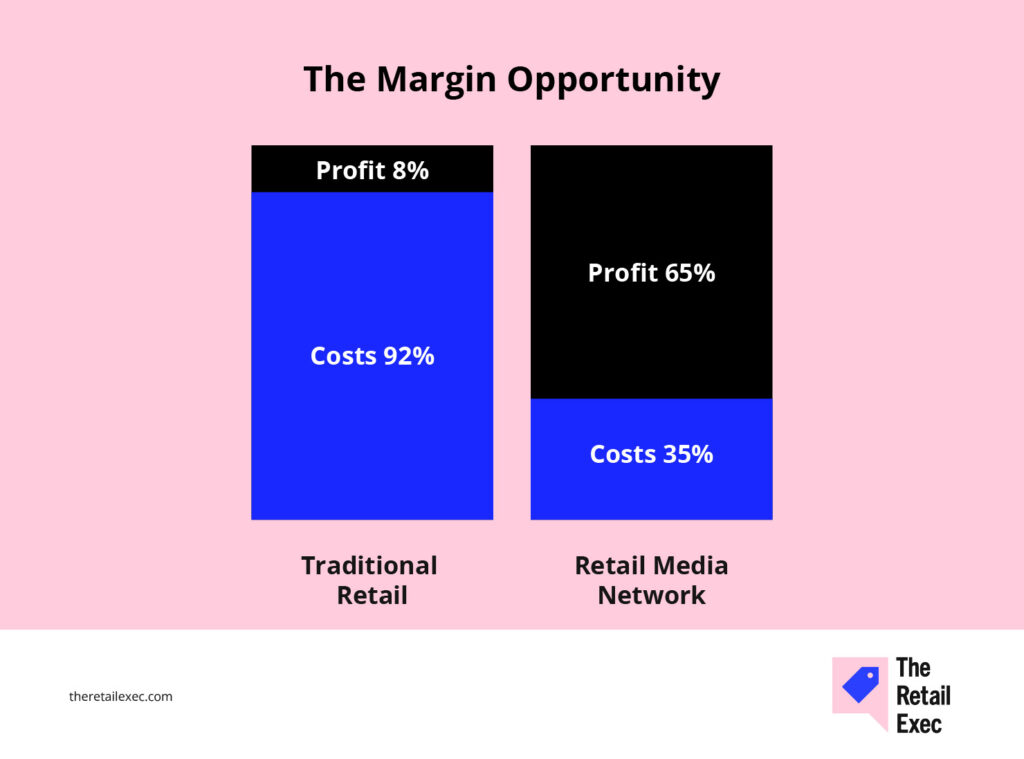
The profit margins tell an even more compelling story: retail media networks generate 60-70% profit margins compared to traditional retail's 5-10%.
What's changed? Technology partners now make retail media networks accessible to retailers without Amazon-level resources. You don't need a thousand-person team or a proprietary tech stack to build a profitable advertising platform.
In this guide, you'll learn exactly how mid-market retailers are building retail media networks—from revenue models and technology decisions to a step-by-step implementation roadmap.
You'll discover why 2026 is the breakthrough year for in-store ads, how non-endemic advertisers are opening new revenue streams, and how to launch in 90 days.
What is a Retail Media Network, and Why Does It Matter?
A retail media network (RMN) is a technology platform owned and operated by a retailer that allows brands to advertise across the retailer's digital and physical properties.
RMNs monetize ad space across a retailer’s website, mobile app, in‑store ads, and off‑site programmatic. Think on‑site search and display ads, off‑site retargeting via programmatic and CTV, and closed‑loop attribution tying impressions to baskets.
At its core, a retail media network monetizes two assets you already have: customer traffic and first-party data.
Unlike traditional advertising networks that take a significant cut, retailers using RMNs capture 100% of the advertising revenue at 60%+ profit margins.
When shoppers visit a retailer’s website or stores, brands pay to reach them with targeted ads at the moment they're ready to buy.
Three primary revenue streams
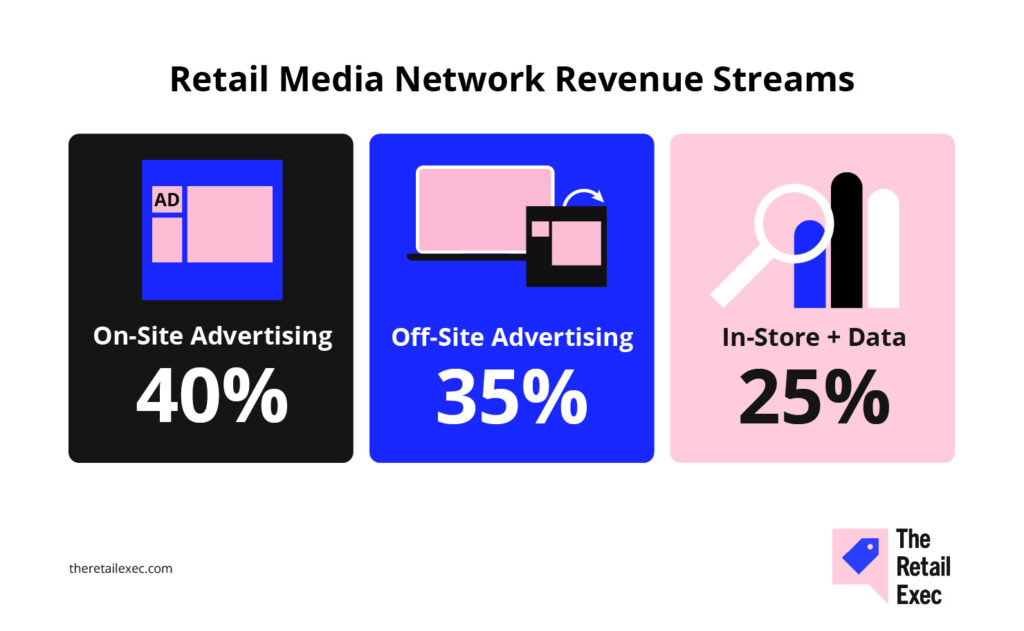
Retail media networks generate revenue through three distinct channels, each with different pricing models and growth trajectories:
- On-site advertising (40% of revenue). Brands bid on sponsored product ad placements, display ads, and video ads across your ecommerce site and mobile app. Pricing is typically cost-per-click (CPC) ranging from $0.50–$3.00, or cost-per-mille (CPM) at $10–$40.
- Off-site advertising (35% of revenue). Your first-party audience data becomes valuable beyond your own properties. Retailers sell access to their audiences on external channels like connected TV (CTV), digital out-of-home (DOOH), and social media. CTV advertising is growing 45.5% in 2025 and commands premium CPMs of $25–$60.
- In-store + data monetization (25% of revenue). In-store digital screens at checkout, entrances, and aisles represent the biggest untapped opportunity—growing 47% in 2025. Retailers also sell anonymized shopper insights, analytics dashboards, and closed-loop measurement to brand partners.
Leading retail media platforms package these surfaces with unified planning and attribution—turning ad dollars into a new revenue stream with predictable margins.
McKinsey forecasts retail media ad spend will grow from approximately $45 billion to over $100 billion by 2026, with retail media on track to surpass television by 2028.
Why Mid-Market Retailers Can Compete (And Win)
Yes, Amazon and Walmart control 84.2% of retail media digital ad spending—but the total retail media market is expanding so rapidly (20% annually) that there's room for dozens of successful networks serving specialized audiences.
What mid-market retailers have that giants don't
Mid-market retailers possess three distinct competitive advantages over Amazon and Walmart:
- Niche audience specialization. A specialty outdoor retailer knows more about camping enthusiasts than Amazon ever will. A retailer’s first-party data captures specific customer behaviors and preferences that advertisers will pay premiums to access.
- Higher engagement rates. Customers shopping at specialty retailers often have higher intent than general marketplace browsers. This translates to better ad performance and higher willingness to pay from advertisers.
- Existing supplier relationships. You already have partnerships with brands that view your retail shelves as valuable real estate. Extending that relationship to digital advertising revenue is a natural progression.
The rise of non-endemic advertisers
One of the most significant trends is the entry of non-endemic advertisers—brands that don't sell products through your core channels. This dramatically expands your addressable market.
Real-world examples:
- Ulta Beauty partnered with Hulu and PayPal to advertise on their retail media network.
- Walmart opened to automotive, entertainment, financial services, and travel advertisers.
- Albertsons shows automotive ads to customers buying Goldfish crackers (families with kids = minivan prospects).
- Airlines advertise to customers shopping for carry-on suitcases.
7-Eleven's success:
Since launching in March 2023, 7-Eleven has delivered over $2 million in sales, engaged 40 vendors, and completed 20 campaigns—proving mid-market retailers can build profitable RMNs.
One critical threshold: 99% of CPG brands demand access to 6 million shoppers or more, or the ability to interoperate with other networks.
If you don’t have 6 million shoppers, integrate into Walmart Connect, Roundel (Target), Kroger Precision Marketing, Instacart, or Amazon Ads to expand addressable reach while building your own value.
| Non-endemic category | Example brands | Targeting logic |
|---|---|---|
| Streaming services | Hulu, Netflix | Demographics, entertainment preferences |
| Financial services | PayPal, credit cards | Purchase behavior, income signals |
| Insurance | Auto, home, life | Life stage indicators (moving, new baby) |
| Automotive | Car brands | Family indicators (buying kid products) |
| Travel | Airlines, hotels | Luggage purchases, vacation signals |
Revenue Models: Why the Margins are 60-70%
The extraordinary profitability of retail media networks stems from four factors:
- No inventory costs. You're selling digital ad space and data insights, not physical products.
- Leveraging existing assets. Customer traffic and data you've already invested in.
- Minimal marginal costs. Serving another ad costs nearly nothing.
- Premium pricing. Advertisers pay more for first-party data and point-of-purchase access.
Traditional retail generates $100 in revenue with $90–95 in costs, leaving $5–10 profit. A retail media network generates $100 in advertising revenue with $30–40 in costs, leaving $60–70 profit.
For a retailer operating on 8% net margins, adding a retail media network that generates even 5% of total revenue at 65% margins can increase overall company profitability by 25-30%.
| Revenue stream | % of total | Pricing model | Typical rate | Growth rate 2025 |
|---|---|---|---|---|
| On-site advertising | 40% | CPC, CPM | $0.50–$3 CPC / $10–40 CPM | 15–20% |
| Off-site (CTV, programmatic) | 35% | CPM | $25–60 CPM | 35–45% |
| In-store advertising | 15% | CPM | $10–50 CPM | 47% |
| Data monetization | 10% | Fixed fee | $5K–50K/month | 20–25% |
The Technology Decision: Build vs Partner
The most critical early decision is how to approach the technology infrastructure for your retail media network.
The reality: most mid-market retailers should partner initially, not build from scratch.
The partner approach: Plug-and-play retail media platforms
Working with established retail media technology providers (Criteo, CitrusAd, PromoteIQ, Mirakl Ads, Grocery TV) offers turnkey solutions.
Here are the advantages:
- Speed to market. 3–6 months vs 12–18 months for proprietary builds.
- Lower upfront investment. $100K–$500K vs $2–5M to build.
- Proven technology. Battle-tested platforms already serving major retailers.
- Ongoing innovation. Partner continuously improves the platform.
Here are the disadvantages:
- Revenue share. Partners typically take 15–30% of ad revenue.
- Less customization. You adapt to their platform.
- Platform lock-in. Switching providers later can be difficult.
The hybrid model: best of both worlds
Many successful retailers adopt a hybrid approach: partner initially to launch quickly, then gradually build proprietary capabilities.
- Phase 1 (months 1–12). Launch with platform partner.
- Phase 2 (months 12–24). Add in-store advertising through separate partner.
- Phase 3 (months 24–36). Build proprietary measurement on your data warehouse.
- Phase 4 (months 36+). Transition to composable architecture for high-value segments.
| Approach | Timeline | Investment | Revenue share | Best for |
|---|---|---|---|---|
| Platform partner | 3–6 months | $100K–$500K | 15–30% | Fast launch, proven model |
| Composable build | 6–12 months | $500K–$1.5M | 0% (component costs) | Data control, long-term play |
| Hybrid | 3–6 months → expand | $100K–$500K Year 1 | 15–30% → 0% over time | Balance speed with control |
4-Step Implementation Roadmap
Here's the proven roadmap that successful mid-market retailers follow, from strategic planning to pilot launch.
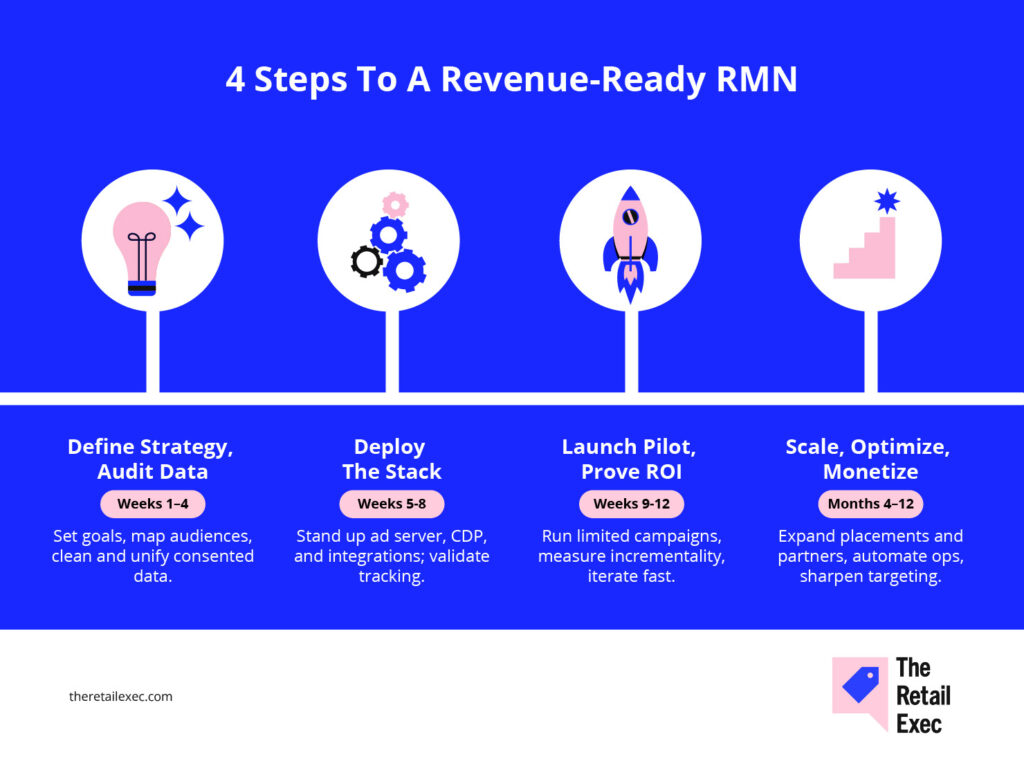
Step 1: Define strategy and organize data (weeks 1–4)
Start your retail media network journey by building strategic alignment and preparing your customer data infrastructure.
Strategic foundation:
- Assemble a cross-functional team. Include Marketing, IT, Merchandising, Finance, and Legal representatives.
- Define primary goal. Revenue growth? Supplier relationships? Customer experience enhancement?
- Choose pricing model. CPC, CPM, or hybrid approach.
- Set Year 1 targets. 0.5–2% of total revenue is realistic for first year.
Data audit:
- Map all customer data sources. Unify ecommerce, POS, loyalty programs, retailer’s website, mobile app; map consent and first‑party data quality; design a closed‑loop model.
- Assess quality and completeness. Identify gaps and data quality issues.
- Implement identity resolution. Connect online and offline behavior for unified customer views.
- Set up data clean rooms. Enable privacy-compliant data sharing with advertisers.
- Ensure GDPR/CCPA compliance. Audit data collection and usage practices.
Step 2: Select technology and partners (weeks 5–8)
With strategy defined and data mapped, focus shifts to selecting the technology foundation for your network.
Evaluate 3–5 platform partners:
- Request demos and proposals. See platforms in action before deciding.
- Check references. Talk to 3–5 current customers about their experience.
- Score objectively. Rate features, integration complexity, pricing, measurement capabilities.
- Negotiate contracts. Ensure you own your customer data.
Begin integration:
- Integrate core systems. Connect ecommerce platform, POS, CRM, analytics.
- Set up ad serving. Implement campaign management infrastructure.
- Build measurement foundation. Deploy attribution and analytics tracking.
Step 3: Launch 3-month pilot (weeks 9–12)
Test your retail media network with a small group of strategic advertisers before full-scale launch.
Select 5–10 pilot advertisers:
- Choose existing vendor partners. Pick brands with existing budgets and relationships.
- Target $5K–$20K media spend per advertiser. Enough to test meaningfully.
- Offer discounted rates. Exchange for feedback and patience during pilot.
Go live:
- Launch campaigns in ad server. Get first ads running.
- Monitor closely first 48–72 hours. Catch technical issues early.
- Establish weekly check-ins. Maintain close communication with each advertiser.
- Document learnings. Capture optimization opportunities and pain points.
Pilot success criteria:
- Advertiser satisfaction: 8+ NPS score
- Campaign ROAS: 3–5x for endemic advertisers
- Platform uptime: 99%+ availability
- Revenue: $25K–$100K in pilot quarter
Step 4: Scale operations (months 4–12)
After a successful pilot, systematically expand your advertiser base and advertising inventory.
Expand advertiser base:
- Approach all brands systematically. Target brands selling through your channels.
- Achieve 50%+ category penetration. Focus on top-performing categories first.
- Begin pitching non-endemic categories. By month 9, add automotive, insurance, travel.
Add channels:
- Months 1–6: On-site sponsored products and display
- Months 6–12: In-store digital screens
- Months 12–18: Off-site programmatic and CTV
Build self-service platform:
- Enable smaller advertisers. Let them create campaigns without sales support.
- Provide real-time dashboards. Give advertisers budget management tools.
- Improve unit economics. Make long-tail advertisers profitable.
Why 2026 Is the Year of In-Store Retail Media
The biggest opportunity is actually sitting in your physical stores—where 80% of consumer spending still happens.
The in-store gap
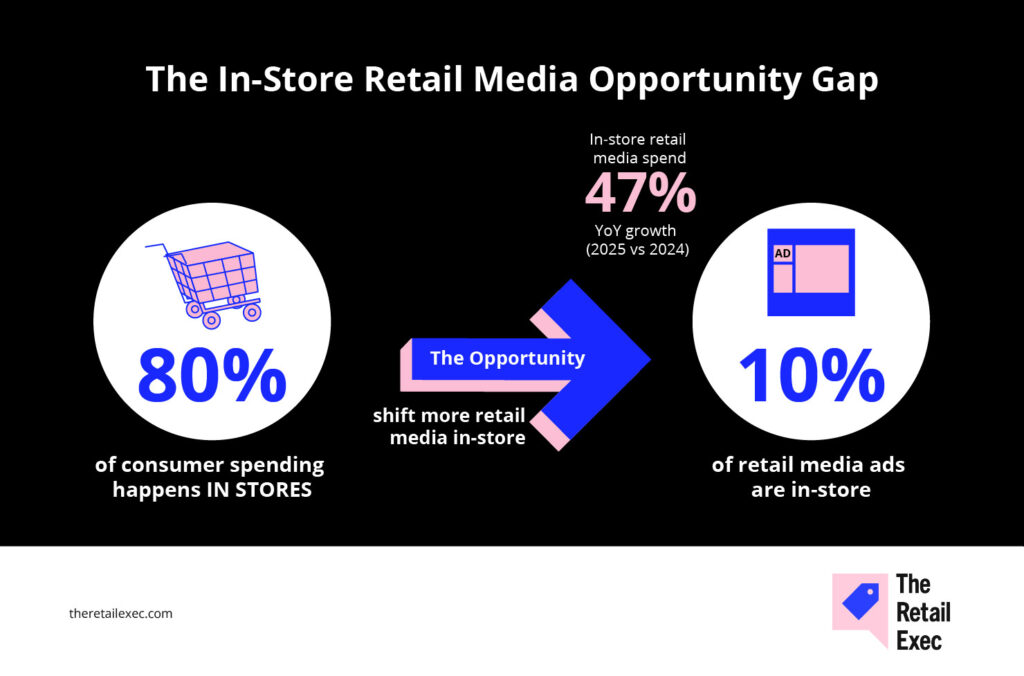
Nearly 80% of consumer spending occurs in physical stores, yet only 10% of retail media advertising happens in-store.
This massive disconnect represents an unprecedented arbitrage opportunity.
In-store retail media ad spending is growing 47% in 2025 and will surpass $1 billion by 2028—far outpacing the 20% growth of overall retail media.
Digital screen networks
Modern in-store retail media extends far beyond simple checkout screens:
- Entrance screens (40"–55"). Welcome customers, showcase promotions. CPM: $15–$25
- Checkout screens (10"–15"). Captive audiences with 30–60 second dwell times. CPM: $30–$50 (highest rate due to proximity to purchase)
- Aisle displays. Category-specific screens highlighting adjacent products. CPM: $10–$20
- End-cap digital displays. High-traffic positions capturing customers between sections. CPM: $20–$35
Real-world example:
Iowa-based Hy-Vee partnered with Grocery TV to deploy 10,000 screens across entrances, checkouts, aisles, and end caps.
The deployment generates an estimated $8–12 million in annual high-margin advertising revenue.
Measurement solutions
Digital in-store networks are solving attribution challenges with:
- Loyalty card attribution. Match which ads played in stores during customer visits to actual purchases at checkout. This enables closed-loop measurement: "Customer saw wine ad at 2:47pm, purchased that wine at 3:02pm."
- Mobile app & beacon technology. Bluetooth beacons detect when customers are near specific displays, creating impression logs similar to online advertising.
- Test vs control store methodology. Run campaigns in 50% of stores, measure sales lift vs control stores to prove incrementality.
Your First 90 Days: Action Plan
Here's exactly what to do in your first 90 days to go from decision to pilot launch.
Days 1–30: Strategic foundation
- Week 1. Assemble cross-functional team, designate executive sponsor
- Week 2. Define success metrics, business model, endemic vs non-endemic strategy
- Week 3. Conduct data audit and create readiness scorecard
- Week 4. Research 3–5 technology partners, request demos and proposals
Days 31–60: Partner selection & data prep
- Week 5. Technology partner deep dives with IT team
- Week 6. Select partner, negotiate and sign contracts
- Week 7-8. Begin data integration work, identify 10–15 pilot advertiser candidates
Days 61–90: Pilot launch
- Week 9. Create advertiser pitch materials and proposal templates
- Week 10. Set up measurement infrastructure and advertiser dashboards
- Week 11. Recruit and onboard 5–10 pilot advertisers ($5K–$20K each)
- Week 12. Launch pilot campaigns, monitor closely, establish weekly check-ins
Success metrics for day 90
By day 90, you should have:
✅ Strategy brief aligned across stakeholders
✅ Signed technology partner contract
✅ Customer data flowing to ad platform
✅ 5–10 advertisers with active campaigns
✅ Attribution working, dashboards live
✅ $25K–$100K in pilot revenue
✅ 7+ NPS score from pilot partners
These milestones position you to scale from pilot (5–10 advertisers) to scaled operations (50+ advertisers) over the following 12 months.
| Phase | Timeframe | Key activities | Deliverables |
|---|---|---|---|
| Strategic foundation | Days 1–30 | Team formation, strategy definition, data audit, vendor research | Strategy brief, data scorecard, vendor shortlist |
| Partner selection | Days 31–60 | Vendor evaluation, contract negotiation, integration start | Signed contracts, integration plan, advertiser list |
| Pilot launch | Days 61–90 | Measurement setup, advertiser onboarding, campaign launch | Live campaigns, dashboards, revenue |
Common Mistakes to Avoid
Three critical mistakes that derail retail media networks:
- Inadequate measurement. Inability to prove incrementality erodes advertiser trust. Solution: Implement industry-standard metrics (ROAS, multi-touch attribution) and incrementality testing from day one.
- Optimizing for clicks instead of conversions. High CTR means nothing if ads don't drive sales. Solution: Configure ad serving to optimize toward purchases and revenue, not just engagement.
- Ignoring in-store. Spending entire budget on online while 80% of sales happen in stores. Solution: Launch in-store advertising within first 12–18 months with 100–200 screens at checkout and entrance.
The Retail Media Opportunity Is Now
Retail media ad spending is growing at 20% annually, with the channel on track to surpass television by 2028.
For mid-market retailers, this represents profit margins of 60–70% compared to traditional retail's 5–10%—a transformational opportunity to offset margin pressure.
The competitive advantage window is now.
In-store advertising is still in early innings. Non-endemic advertisers are just beginning to explore retail media beyond Amazon and Walmart. The retailers who build networks today will establish first-mover advantage that late entrants will struggle to match.
You don't need Amazon's resources.
Strategic technology partners have democratized retail media infrastructure. You need customer traffic (ideally 6+ million shoppers annually), quality first-party data, and the willingness to invest 6–12 months building the capability.
Your next steps: Start with a data audit. Map your customer data sources, assess their quality, and identify gaps. Then evaluate 3–5 technology partners to understand implementation timelines and investment requirements.
The retailers winning in retail media aren't the ones with the biggest budgets—they're the ones who started building early. The question isn't whether to build a retail media network. It's whether you'll build it before your competitors do.
Retail never stands still—and neither should you. Subscribe to our newsletter for the latest insights, strategies, and career resources from top retail leaders shaping the industry.