How To Calculate Inventory Turnover Ratio: Guide + Tools


Retailers Need Turnover Excitement: For retail businesses, understanding inventory turnover is crucial as it impacts their ability to convert stock into cash efficiently, turning potential clearance problems into opportunities for profit.
Healthy Shelves, Happy Business: A satisfactory inventory turnover implies shelves remain fresh and financially smart, preventing stagnant stocks and ensuring resources are not wasted on unsold goods.
Beware the Turnover Red Flags: A poor turnover rate is a serious concern for retail businesses, indicating a need for strategy reassessment to avoid financial strains related to unsold inventory.
Decoding Turnover Calculations: Knowing how to calculate inventory turnover accurately requires knowledge of sales and inventory cycles, ensuring decisions are based on accurate performance metrics rather than assumptions.
Use Your Numbers, Make More Money: Using inventory turnover data intelligently can lead to informed decisions, optimizing sales strategies, and ultimately increasing profitability and business efficiency.
Inventory turnover sounds like something only accountants get excited about—but if you run a retail business, it’s the difference between a cash machine and a clearance rack nightmare.
Turnover tells you how fast you’re moving products out the door (and how fast you’re getting paid).
A healthy turnover rate means your shelves aren't museum exhibits, and your money isn't tied up in dusty stock. A bad turnover rate? That’s a neon flashing sign that says, “Hey, maybe rethink everything.”
In this guide, I’ll break down how to calculate inventory turnover the right way, why it’s not as simple as “higher is better,” where most people trip up, and how to actually use your turnover data to make smarter, faster, more profitable moves.
Because if you’re going to run a business, you might as well run a good one.
What is Inventory Turnover? (Definition + Formula)
Inventory turnover is the rate at which you sell and replace inventory within a given period of time.
The basic calculation is the cost of goods sold (COGS) divided by average inventory:
Cost of Goods Sold (COGS) / Average Inventory Cost = Inventory Turnover
Want to skip the math? Use our Inventory Turnover Calculator below to quickly find your turnover ratio based on your real data:
You can monitor this per period (i.e., monthly, quarterly, annually), but most ecommerce stores opt for monthly calculations.
A high inventory turnover ratio indicates efficient inventory management, strong sales, and little room for optimization. On the other hand, a low rate suggests weak sales, overstocking, and significant room for optimization.
For example, if your Amazon electronics retail store has a COGS of $1,200,000 and an average inventory of $100,000, the calculation would be as follows:
1,200,000 / 100,000 = 12
This reveals your store has a complete inventory turnover 12 times per year, meaning you replace the full inventory every monthly period.
For most businesses, an inventory turnover of 12 would indicate efficient operations, depending on lead times, cost to replenish, etc. For example, if your cost to replenish is very high, you might be adding on extra costs by keeping inventory turnover at a monthly cycle.
However, if your store has a COGS of $800,000 and an average inventory of $200,000, this would mean the store only sells through stock about four times per year, or once a quarter (800,000 / 200,000 = 4).
This is concerning, as it drives high warehousing costs (especially with FBA) and potential cash flow problems, because capital is tied up in expensive, slow-moving stock.
But, we’re getting ahead of ourselves.
We’ll dig more into how to interpret your results later on here. First, let’s look at the metrics that you need to calculate inventory turnover.
Key Components of Inventory Turnover
If you have insight into your data, calculating inventory turnover is relatively simple.
If you don’t though, you’ll first have to collect that information and make sure you establish a method of tracking and accounting for inventory on a periodic basis (i.e., inventory management software).
The two variables used to calculate this important rate are COGS and average inventory, both of which an inventory management software solution will automatically calculate for you.
Cost of goods sold (COGS)
COGS is the most significant factor in the inventory turnover calculation. Quantifying it requires a firm grasp on your ingoing and outgoing stock, which you can total using this formula:
Beginning Inventory + Purchases During a Given Period - Ending Inventory = COGS
Wherein:
- Period: A specified time frame, usually monthly but potentially aligned with sales or restock periods
- Beginning Inventory: The value of inventory at the start of the accounting period (e.g., inventory left over from the previous period)
- Purchases During a Given Period: Any inventory purchased during a specified time frame
- Ending Inventory: Inventory remaining at the end of the financial period
COGS is used to calculate everything from gross profit (Revenue – COGS = Gross Profit) to inventory turnover, profit margins, pricing strategies, and more.
Average inventory
Average inventory defines the median amount of stock you have each period.
Normally, you’d calculate this on a monthly basis or by aligning it with your inventory account periods.
This formula allows you to pinpoint average inventory per month or some other defined period:
Beginning Inventory + Ending Inventory / 2 = Average Inventory
For an Amazon retail store, that might look something like:
50,000 + 70,000 / 2 = 60,000
You can turn that into annual average inventory by finding the sum of your monthly inventories and dividing by 12:
Sum of all Monthly Average Inventory / 12 = Annual Average Inventory
However, most retail stores see significantly high and low peaks around holidays and vacation periods.
So, it’s often better to calculate average inventory each month and adjust restock decisions based on those quotients.
As an example, if your store has an sales of $50,000–$60,000 per month but $120,000–$150,000 during the holiday period and $30,000 in stock during the months of July and August, you might see something more like:
∑ (55,000 x 8) + 120,000 + 150,000 + (30,000 x 2) / 12 = 64,000
Note: ∑ represents the sum of the subsequent values.
However, note that, provided your normal sales are relatively steady, and you have a low season, holiday peaks will still bring your average inventory close to normal.
How to Interpret Inventory Turnover Ratio Results
Most brands should aim for an inventory turnover of five to 12, that is, inventory is fully replenished every four to eight weeks.
That being said, a higher turnover rate isn’t necessarily positive, while a lower turnover rate isn’t definitively negative.
Factors like supply chain disruptions, costs of restock and replenishment, and warehousing expenses all affect this calculation.
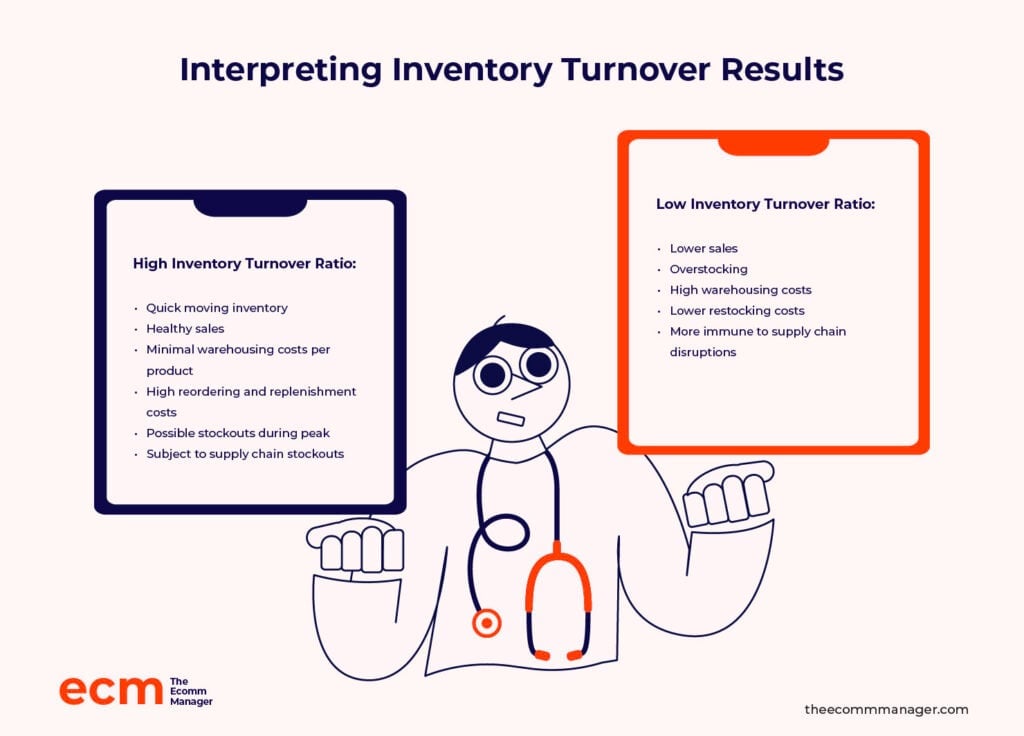
High inventory turnover ratio
A high turnover rate is typically eight or more and indicates:
- Inventory moves in and out of your warehouses quickly.
- Sales are healthy or high compared to forecasts.
- Warehousing costs per product should be minimal.
On the other hand, it can also mean:
- Costs of reordering and replenishment are high (e.g., Amazon FBA’s Placement fees can be significant)
- The store risks facing a stockout if sales peak higher than expected
- Any strain on the supply chain can result in stockouts and backorders
Going back to the electronic store example, an inventory turnover ratio of 12 would see you completely go through stock every month.
So, if you experienced a peak in sales and then a week's delay in shipment from the supplier, you’d run out of inventory.
On average, high inventory turnover ratios are ideal for reducing costs. But, if too high, they’ll produce the opposite effect by adding shipping and stocking costs and possibly increase risks.
Low inventory turnover ratio
A low inventory turnover ratio is normally five or lower and means you take eight or more weeks to go through a full inventory cycle.
From this, you can infer:
- Sales are lower than forecasted
- You’re overstocking
- Warehousing costs are higher because of increased time to store
However, low inventory turnover ratios can have benefits as well:
- Restock expenses are lower. If the cost of shipment is higher than the cost of storage, you may benefit from a lower inventory turnover ratio.
- Supplier availability is inconsistent. So, if supply chain disruptions are predicted, for example, overstocking may aid your business.
A low inventory turnover ratio can lead to overstocking, higher holding costs, dead stock, and cash flow issues.
However, it’s important to look at the factors that influence your supply chain, distribution, and costs when optimizing.
Industry inventory turnover benchmarks
Optimal turnover rates depend on your industry and cost of goods. For instance, if you look at Amazon’s product categories, industry benchmarks include:
| Industry | Inventory turnover ratio benchmark | Notes |
|---|---|---|
| Electronics | 8-12 | New innovations, high cost of inventory, and changing customer demand mean a higher turnover reduces risk for sellers. |
| Fashion and apparel | 4-8 | Seasonal trends and fashion cycles are your largest influencers, meaning inventory cycles should largely be tied to seasons. |
| Books | 1-2 | Depending on the books, most have high order and supply costs but low warehousing expenses and relatively stable demand after the first year of production. |
| Health and beauty | 6-9 | Products go out of date and should be moved through inventory relatively quickly to reduce dead and excess stock. |
| Home and kitchen | 3-6 | Steady demand means sales are predictable, and you can optimize for warehousing versus inbound shipment and placement costs. |
| Toys and games | 4-7 | With significant seasonal peaks, inventory has to be planned around selling three-quarters of it over two to three months of the year. |
| Grocery and gourmet food | 12-15 | Perishable goods and high frequency of purchase necessitate a high turnover. |
| Sporting goods | 3-5 | Seasonal and low demand for specific products cause a less frequent turnover, so brands can plan inventory around larger reorder points, depending on the local cost of warehousing. |
| Automotive parts and accessories | 2-4 | Specific demand and long product life cycles mean it’s usually more efficient to maintain stock for longer periods. |
| Pet supplies | 5-8 | Steady demand coupled with perishable products often translate to ideal restock points being about every two months. |
Essentially, your inventory turnover ratio will vary considerably depending on your product niche, rate of sales, seasonal demand, and the like.
Key factors that impact inventory turnover
As mentioned above, several elements influence inventory turnover, including:
- Seasonality. Categories like toys and games see massive sales spikes during the holiday period, while other products like groceries won’t.
- Trends/innovations. Electronics and games or books can see demand hikes or become irrelevant due to innovations or new trends.
- Product life cycle. Products like books typically have a long product life cycle, whereas those like electronics can become outdated as soon as a new model is released.
- Consumer demand. Consumable goods typically have a much higher turnover than non-consumable goods.
You should also take into account other aspects to tweak your turnover ratio:
- Cost of warehousing vs cost of supply. Most ecommerce sellers prefer to optimize for cost reduction.
- Risk of high/low stock. Find the safe middle ground between potentially overstocking or under-stocking by reviewing factors like market volatility, supply chain stability, and risk of damage in warehouses.
With these two contributing elements in mind, you can determine whether it’s better to restock more frequently and take on added costs of shipment and placement, or order larger volumes at once and take on the risks of deadstock and overstocking.
Improve your inventory turnover with a perpetual inventory system, ensuring faster restocking and reducing excess stock by tracking sales in real time.
But even beyond these factors, inventory turnover isn’t a flawless metric. If you’re not careful, it can tell you a pretty incomplete—or even misleading—story.
Let’s break down the limitations you need to watch out for.
Limitations of Inventory Turnover Ratios
Look, inventory turnover is useful—but it’s not the oracle of truth some people treat it like. There are real limitations you need to keep in mind before you start making sweeping decisions based on a single number.
Here’s what can trip you up:
- Industry differences matter. A “good” turnover ratio looks wildly different in a grocery store versus a furniture shop. Perishables fly off the shelves. Couches? Not so much. Always benchmark against your industry, not some generic best practices article.
- Seasonality skews everything. Retail lives and dies by seasons—holiday spikes, summer slumps, back-to-school booms. If you’re not adjusting for seasonal swings, your turnover math is lying to you.
- Cost variations twist the numbers. Remember, turnover calculations use cost of goods sold (COGS), not sales revenue. If your product costs fluctuate (looking at you, supply chain chaos), it’ll mess with your turnover ratio whether or not your actual sales volume changes.
- Carrying costs don’t show up. High turnover might sound sexy, but if you’re constantly rushing inventory in and out, it could jack up your carrying costs (like expedited shipping, rush storage, and overtime labor). Turnover alone won’t tell you if you’re actually running more profitably.
- Lead times sneak in. If your suppliers take forever to deliver, you might intentionally keep more inventory on hand. That’ll drag down your turnover ratio—but it might be the smarter move for your business. Context matters.
Bottom line: inventory turnover is a signal, not a solution. It’s powerful when you know how to read it, but dangerous if you don’t zoom out and see the bigger picture.
Challenges That Can Tank Your Inventory Turnover
Even if you know your inventory turnover ratios inside and out, actually managing inventory is a whole different battlefield. Real-world challenges can drag your turnover down, jack up your costs, and leave you scrambling if you don’t get ahead of them.
Here’s what usually makes life harder:
- Changing customer demand. Consumers are fickle creatures. What’s hot today could be dead stock tomorrow. Predicting demand wrong—by even a little—can wreck turnover ratios and cash flow.
- Poor supply chain planning. If you’re not thinking two, three, or four steps ahead with suppliers, you’re setting yourself up for stockouts, late shipments, and chaotic replenishment cycles.
- Overstocking “just in case.” It feels safe to stockpile, especially if you’ve been burned by shortages before. But overstocking kills turnover, clogs up cash flow, and racks up carrying costs.
- Inconsistent supplier performance. Even your best forecasts can’t save you if your suppliers are unreliable. Long lead times, sudden shortages, and shipping delays all torpedo smooth inventory flow.
- Seasonal and promotional unpredictability. Even if you plan around obvious peaks (like holidays), promotions, weather shifts, and viral trends can slam your forecasts sideways, leaving you with too much—or too little—inventory.
- Data blind spots. If your sales and inventory data aren’t clean, current, and connected, your decisions will always be a step behind reality. Guessing your way through inventory management is an expensive game.
Challenges are inevitable. What matters is how early you spot them—and whether you’ve built a flexible enough system to adapt when (not if) something goes sideways.
Now that we’ve looked at what can go wrong, let’s get into the good stuff: real strategies you can use to boost your inventory turnover and stay ahead of the chaos.
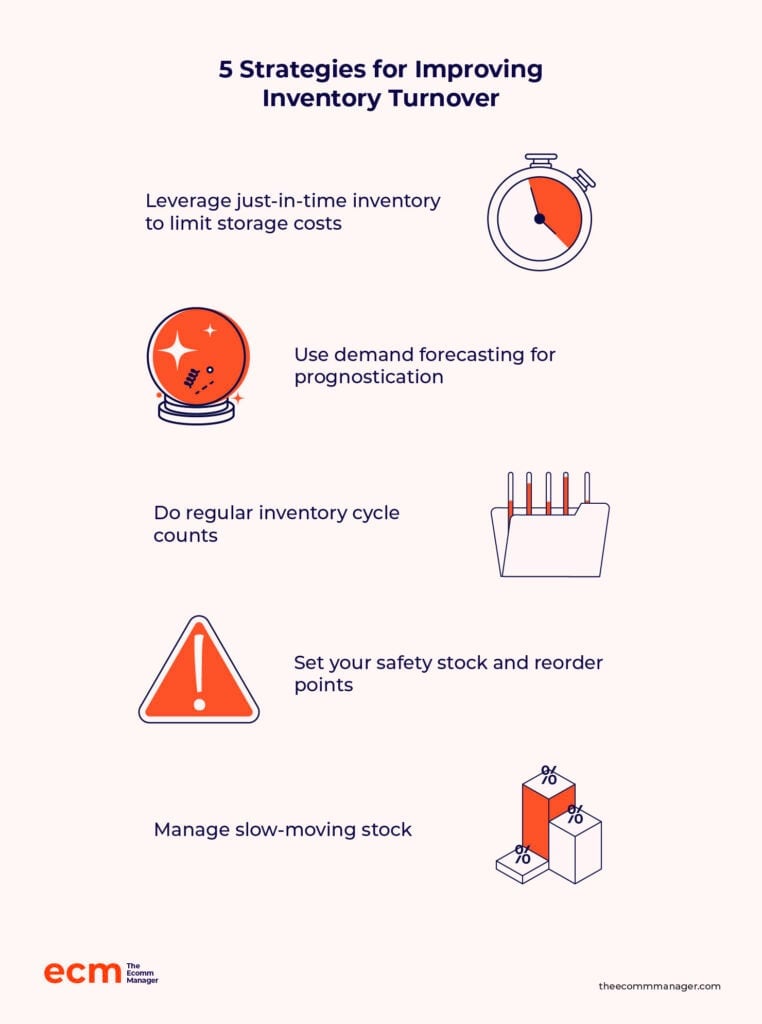
5 Strategies For Improving Inventory Turnover
You can improve your inventory turnover in a number of ways.
In most cases, these strategies largely require keeping an eye on inventory and adopting a quality inventory management solution.
1. Leverage just-in-time inventory to limit storage costs
Just-in-time-inventory (JIT) is an inventory management strategy that aims to maintain high inventory turnover ratios by cutting stock down to what’s needed for immediate sales.
That means you look at lead times for reorder and restock and order the minimum amount necessary to make it through that period.
JIT frees up cash flow, lowers the risk of dead or wasted stock, and reduces the need for warehousing.
However, it can add to costs and increases the possibility of stocking out if demand isn’t properly forecasted or supply chain disruptions slow delivery.
2. Use demand forecasting for prognostication
Demand forecasting uses previous sales data to predict conversions for an upcoming period.
That allows you to adjust inventory per period and stay in line with seasonal demand. Here, factors like seasonality, historic sales trends, external events, and industry benchmarks play a role.
Inventory management software also increasingly employs AI to help businesses better anticipate sales, so you ensure products purchased during a specific period matched the predictions.
3. Do regular inventory cycle counts
Regular inventory cycle counts let you categorize inventory and count it in subsets (such as by category, as you do with ABC analysis).
You can then audit and take inventory more frequently, without conducting a full count at once.
For example, many large warehouses implement daily cycle counts using low periods to mark a category or section.
This reduces the labor for annual physical counts while ensuring inventory values are correct.
4. Set your safety stock and reorder points
Setting smart reorder points keeps you from scrambling to restock when inventory runs low.
But a good reorder point isn’t just about average sales—it needs to factor in a safety margin for unexpected demand spikes or supplier delays.
Safety stock is your insurance policy. It's the extra inventory you keep on hand to protect against the unknown. Without it, one late shipment or a surprise sales rush could wipe you out before your new stock arrives.
Here’s the basic idea:
- Safety stock covers variability (delays, demand spikes).
- Reorder point tells you when to place a new order based on average sales plus your safety stock buffer.
To find your safety stock, you'll usually factor in:
- Average daily sales
- Average lead time
- Demand variability
- Supply variability
And to calculate your reorder point:
Reorder Point = (Average Daily Sales × Lead Time) + Safety Stock
Don't want to manually crunch the numbers? Use the calculators below to get your ideal safety stock and reorder point based on your real data.
Once you have the right numbers dialed in, you can prevent costly stockouts without ballooning your carrying costs—and stay ahead of supply chain chaos without breaking a sweat.
Most inventory management software solutions will automate this for you—you just have to decide on priorities for safety stock.
5. Manage slow-moving stock
Slow-moving stock opens the risk of overstocking and increased holding costs, and so can hurt sales on platforms like Amazon.
An ABC analysis allows you to see which items are slow so you can optimize accordingly.
Some inventory naturally doesn’t move fast.
In this case, you can refine your purchase and sales strategy, experiment with different marketing and merchandising, or reduce order volumes with the supplier to decrease stock levels.
Related Inventory Ratios to Know
Inventory turnover is powerful—but it’s not the only number worth tracking.
If you want a full 360° view of your inventory health, it helps to layer in a few other key metrics that can show you what turnover alone might miss.
Here are a couple of heavy hitters:
- Days sales of inventory (DSI). This tells you how many days, on average, it takes to sell through your inventory.
- Why it matters: A lower DSI means you’re moving stock quickly. A higher DSI means inventory is lingering longer than you'd like.
Days Sales of Inventory = (Average Inventory ÷ COGS) × 365
- Inventory-to-sales ratio. This measures how much inventory you have compared to your net sales over a period.
- Why it matters: A high inventory-to-sales ratio could mean you’re overstocked relative to how much you’re selling—aka, more risk of dead stock and cash flow problems.
Inventory-to-Sales Ratio = Average Inventory ÷ Net Sales
Each of these ratios gives you another lens to evaluate how efficiently you're managing your inventory—and together, they paint a much sharper picture than inventory turnover alone.
What Your Inventory Turnover is Really Telling You (and What To Do About It)
Inventory turnover isn’t just a warehouse stat—it’s a window into your business’s financial and operational reality. When you know how to read it, it reveals what’s working, what’s not, and where to dig deeper.
A low turnover ratio might mean you’re overstocked, holding onto products that aren’t selling, and tying up capital that could be used elsewhere. But it could also suggest weak demand, pricing that's off, or a product that’s overstayed its welcome.
A high turnover ratio? That’s usually good—but not always. If you're constantly selling out, you might be under-ordering or underpricing, which leads to missed revenue and margin erosion thanks to emergency reorders or customer churn from stockouts.
Once you start reading turnover this way, it stops being a static number and starts acting like a decision-making radar. You can use it to:
- Spot weak SKUs. If a product is dragging your average turnover down, it may be time to reprice, remerchandise, or cut it loose.
- Refine reorder points. High-turnover SKUs might justify more frequent, smaller restocks—while slow movers need a cautious hand.
- Pressure-test supplier relationships. If certain products always run low, turnover helps you build the case to renegotiate lead times or safety stock thresholds.
- Adjust promotions and pricing. A drop in turnover on previously fast-moving items could signal it’s time for a promo or a strategic price cut.
- Plan lifecycle transitions. Turnover trends can show when a product’s heyday is fading—giving you time to phase it out before it eats your margins.
Inventory turnover is more than a KPI. It’s the canary in the coal mine, the flashlight in the stockroom, the operator’s shortcut to smarter decisions.
The more fluently you speak its language, the better you steer your store—financially and operationally.
How Inventory Management Software Can Improve Inventory Turnover
Inventory management software (IMS) is a must-have for any ecommerce store. It uses real-time data to:
- Automatically calculate inventory turnover per period (typically monthly and yearly)
- Track inventory in real time
- Deliver advanced demand forecasting
- Optimize and potentially automate reorder points
- Prevent stockouts
- Integrate with financial statements for automatic COGS calculations
These are just a few of the benefits of a really great IMS. You want a robust inventory management solution that takes the work out of calculating inventory turnover ratio so all you have to do is look at a dashboard.
And, as with many things, we have opinions. Our favorite inventory management software solutions are (drum roll):


Final Thoughts
Inventory turnover shows you how well your inventory is working for your business—or against it. It connects your purchasing, pricing, and operations to the numbers that actually move your bottom line.
You’ve seen how to calculate it, where it gets messy, and how to use it to spot what’s dragging you down or pushing you forward. You’ve also got the playbook to improve it—and the tools to stop guessing.
Use it to set sharper goals, run tighter ops, and make more confident decisions about what stays, what goes, and what gets doubled down on.
Margins live or die by how fast you move product. This is how you stay in control.
Retail never stands still—and neither should you. Subscribe to our newsletter for the latest insights, strategies, and career resources from top retail leaders shaping the industry.
Inventory Turnover FAQs
Let’s end on some quick answers, in case you still had questions.
What is a good inventory turnover ratio?
A good inventory turnover ratio typically falls between five and 12, meaning you sell and replace inventory five to 12 times a year.
However, the ideal ratio depends on your industry—higher for fast-moving consumer goods, lower for luxury items.
Is high inventory turnover good or bad?
A high inventory turnover is generally good as it indicates strong sales and efficient ecommerce inventory management. But if it’s too high, it could mean you’re not keeping enough stock to meet demand, leading to lost sales.
What should I do about a low inventory turnover ratio?
A low inventory turnover ratio suggests overstocking or weak sales.
To fix this, analyze your inventory to identify slow-moving items, adjust pricing strategies, and improve your marketing efforts to boost sales.
How do I increase my inventory turnover rate?
To increase your inventory turnover rate, streamline your ordering process, optimize your stock levels, and implement dynamic pricing strategies.
Additionally, enhancing your marketing campaigns can help move products faster and keep your inventory fresh.
Setting your reorder point manually works—but it’s faster (and way less painful) with a calculator that does the math for you.
Use the tool below to find your ideal reorder point based on your lead times, sales velocity, and safety stock needs:


