

Le 10 migliori alternative a Tableau per l’analisi della vendita al dettaglio nel 2026

Elenco ristretto delle alternative a Tableau


Una valida alternativa a Tableau offre al tuo team analisi flessibili, visualizzazione intuitiva dei dati e integrazione con le fonti di dati esistenti, senza vincolarti all'ecosistema di un singolo fornitore. Se stai cercando le migliori alternative a Tableau, probabilmente stai valutando i costi, le opzioni di implementazione e la capacità di ogni strumento di adattarsi ai tuoi flussi di lavoro di analisi.
Questo elenco ti aiuterà a confrontare le principali opzioni, così potrai scegliere con sicurezza una soluzione adatta alle esigenze di reporting della tua azienda, ai requisiti tecnici e ai piani di crescita.
Che cos'è Tableau?
Tableau è un software di analisi che consente di visualizzare, analizzare e condividere i dati tramite dashboard e report interattivi. I team utilizzano Tableau per connettersi a più fonti di dati, esaminare le tendenze e presentare gli approfondimenti in formato visivo.
La sua interfaccia con funzionalità di trascinamento e il vasto numero di integrazioni lo rendono popolare per la business intelligence, il reporting e il processo decisionale basato sui dati nei settori della vendita al dettaglio, dell'e-commerce e in altri ambiti.
Riepilogo delle migliori alternative a Tableau
Questo grafico di confronto riassume i dettagli dei prezzi delle mie principali alternative a Tableau per aiutarti a trovare l’opzione migliore per il tuo budget e le esigenze della tua azienda.
| Tool | Best For | Trial Info | Price | ||
|---|---|---|---|---|---|
| 1 | Ideale per monitorare il comportamento dei visitatori del sito web | Piano gratuito disponibile | Prezzi su richiesta | Website | |
| 2 | Ideale per l'analisi delle coorti relative all'utilizzo del prodotto | Piano gratuito disponibile | Prezzi su richiesta | Website | |
| 3 | Ideale per informazioni dettagliate sui funnel comportamentali | Piano gratuito disponibile | Prezzi su richiesta | Website | |
| 4 | Ideale per le analisi integrate nelle applicazioni | Prova gratuita di 7 giorni + demo gratuita disponibile | Prezzi disponibili su richiesta | Website | |
| 5 | Ideale per l'acquisizione automatica dei dati degli eventi | Piano gratuito + demo gratuita disponibile | Prezzi su richiesta | Website | |
| 6 | Ideale per informazioni in tempo reale sulle app mobili | Demo gratuita disponibile | A partire da $40/mese | Website | |
| 7 | Ideale per la flessibilità dell'implementazione autogestita | Piano gratuito disponibile | A partire da $0.00005/event | Website | |
| 8 | Ideale per reportistica incentrata sulla privacy | Prova gratuita di 21 giorni + demo gratuita disponibile | A partire da $26/mese | Website | |
| 9 | Ideale per l'integrazione con l'ecosistema Microsoft 365 | Piano gratuito disponibile | A partire da $14/utente/mese (fatturati annualmente) | Website | |
| 10 | Ideale per la creazione di cruscotti personalizzabili | Versione di prova gratuita disponibile | Prezzi su richiesta | Website |
Perché fidarsi dei nostri consigli sui software
Il nostro team testa e recensisce software dal 2012. In quanto leader del retail noi stessi, sappiamo quanto sia difficile — e importante — scegliere il software giusto.
Per questa guida, abbiamo valutato gli strumenti attraverso test pratici e ricerche indipendenti, assegnando un punteggio agli strumenti in base ai nostri criteri di selezione.
Le nostre recensioni riflettono il nostro giudizio indipendente, non un discorso di vendita.
Recensioni delle alternative a Tableau
Di seguito sono riportati i miei riepiloghi dettagliati delle alternative a Tableau incluse nel mio elenco ristretto. Le mie recensioni offrono uno sguardo approfondito sulle funzionalità, sui casi d’uso migliori e sulle integrazioni di ogni piattaforma, per aiutarti a trovare quella più adatta alla tua azienda.
Ideale per monitorare il comportamento dei visitatori del sito web

Se devi capire esattamente come i visitatori interagiscono con il tuo sito web, Google Analytics offre strumenti dettagliati di monitoraggio e reportistica pensati per i team digitali. È particolarmente utile per i team che si occupano di e-commerce, marketing e contenuti e che desiderano analizzare i percorsi degli utenti, i percorsi di conversione e le prestazioni delle campagne. A differenza di Tableau, Google Analytics è specializzato nella raccolta e nell'attribuzione di dati web in tempo reale, il che lo rende uno strumento di riferimento per ottimizzare le esperienze online.
Perché Google Analytics è una valida alternativa a Tableau
Per i team che si concentrano sulla comprensione del comportamento dei visitatori del sito web, Google Analytics offre strumenti specializzati che Tableau non fornisce immediatamente. Ho scelto Google Analytics perché monitora in tempo reale l'attività degli utenti, le visualizzazioni di pagina e le fonti di traffico direttamente dal tuo sito web. La piattaforma consente inoltre di configurare obiettivi di conversione e analizzare i flussi degli utenti per individuare con precisione i punti in cui i visitatori abbandonano il percorso o effettuano una conversione. Se la tua priorità principale è ottimizzare le esperienze digitali e le campagne, Google Analytics offre le informazioni mirate di cui hai bisogno.
Funzionalità principali di Google Analytics
Alcune altre funzionalità di Google Analytics che i team digitali potrebbero trovare utili includono:
- Monitoraggio personalizzato degli eventi: Configura e monitora azioni specifiche degli utenti, come download, riproduzioni di video o invii di moduli.
- Segmentazione del pubblico: Crea e analizza gruppi di pubblico personalizzati in base a dati demografici, comportamento o canale di acquisizione.
- Reportistica e-commerce: Monitora le prestazioni dei prodotti, i dati delle transazioni e le metriche relative ai ricavi per i negozi online.
- Integrazione con Data Studio: Collegati a Google Data Studio per creare report e visualizzazioni personalizzati utilizzando i tuoi dati analitici.
Integrazioni di Google Analytics
Le integrazioni includono Google Ads, Google Tag Manager, Google Search Console, Google Data Studio, Google Optimize, Google AdSense, Firebase, BigQuery, Display & Video 360 e Search Ads 360.
Pros and Cons
Pros:
- Piattaforma gratuita per l'analisi dei dati del sito web e delle informazioni sul traffico
- Segmentazione del pubblico e monitoraggio dei percorsi di conversione per valutare le prestazioni del marketing
- Facilità d'uso per start-up e piccole imprese che analizzano il comportamento sul web
Cons:
- Strumenti di analisi aziendale limitati rispetto alle piattaforme complete di analisi aziendale
- La configurazione avanzata e l'impostazione dei report possono richiedere molto tempo

Mixpanel
Ideale per l'analisi delle coorti relative all'utilizzo del prodotto

Per i team che si concentrano sulla comprensione del modo in cui gli utenti interagiscono con i prodotti digitali, Mixpanel offre una soluzione di analisi specializzata. È particolarmente utile per i product manager, i team di crescita e le aziende SaaS che devono analizzare le coorti di utenti e monitorare l'adozione delle funzionalità nel tempo. A differenza di Tableau, Mixpanel è progettato per il monitoraggio basato sugli eventi e semplifica la segmentazione degli utenti in base ai modelli di comportamento, fidelizzazione e coinvolgimento.
Perché Mixpanel è una buona alternativa a Tableau
Mixpanel adotta un approccio diverso da Tableau, concentrandosi sull'analisi delle coorti relative all'utilizzo del prodotto. Ho scelto Mixpanel per i team che devono monitorare il modo in cui diversi gruppi di utenti interagiscono con le funzionalità nel tempo. Il monitoraggio basato sugli eventi consente di creare coorti dettagliate basate sulle azioni degli utenti, sulla fidelizzazione e sul coinvolgimento. Mixpanel offre inoltre analisi dei funnel e report sulla fidelizzazione che aiutano a individuare con precisione i punti in cui gli utenti abbandonano il percorso o ritornano, rendendolo particolarmente adatto ai team di prodotto e di crescita.
Funzionalità principali di Mixpanel
Tra le altre funzionalità di Mixpanel che gli acquirenti di soluzioni di analisi potrebbero voler conoscere figurano:
- Analisi dei test A/B: Misura e confronta l'impatto degli esperimenti sul comportamento degli utenti.
- Dashboard personalizzate: Crea e condividi dashboard adattate alle metriche del tuo team.
- Importazione ed esportazione dei dati: Importa dati da altre fonti ed esporta i report secondo necessità.
- Avvisi e notifiche: Configura avvisi automatici per le variazioni o le anomalie delle metriche principali.
Integrazioni di Mixpanel
Le integrazioni includono Segment, Snowflake, Google BigQuery, Salesforce, HubSpot, Slack, Zapier, Airflow e Fivetran.
Pros and Cons
Pros:
- Analisi dei dati comportamentali con informazioni dettagliate su coorti e fidelizzazione
- Gli strumenti di segmentazione aiutano gli utenti aziendali ad analizzare i modelli di coinvolgimento
- Piattaforma cloud progettata per startup e team di prodotto SaaS
Cons:
- Non è progettato per la reportistica di business intelligence su ampia scala
- Le query avanzate possono comportare una curva di apprendimento ripida

Ideale per informazioni dettagliate sui funnel comportamentali
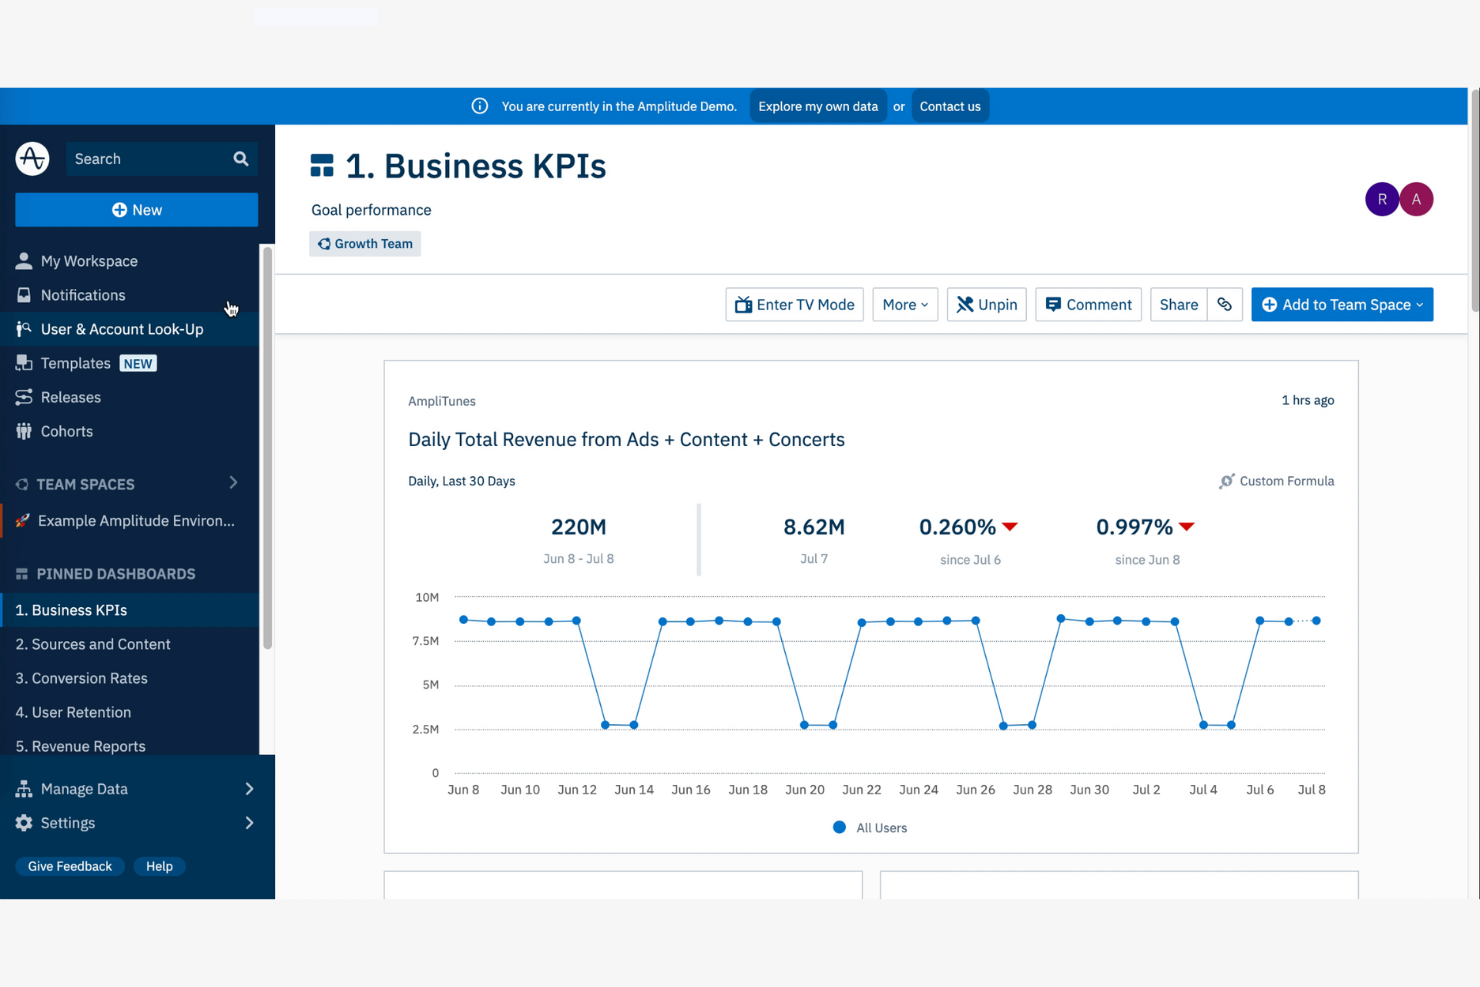
Se hai bisogno di analizzare in dettaglio come gli utenti si muovono all'interno del tuo prodotto digitale, Amplitude è progettato proprio per questo scopo. I responsabili di prodotto, gli analisti della crescita e i team di e-commerce utilizzano Amplitude per scoprire informazioni dettagliate sui funnel comportamentali che vanno oltre i dashboard standard. A differenza di Tableau, Amplitude è specializzato nella mappatura dei percorsi degli utenti e nell'individuazione dei punti in cui gli utenti abbandonano o completano la conversione all'interno di flussi di lavoro specifici.
Perché Amplitude è una buona alternativa a Tableau
Amplitude si distingue per i team che devono analizzare in dettaglio i funnel comportamentali. Ho scelto Amplitude perché consente di visualizzare ogni passaggio compiuto dagli utenti prima della conversione o dell'abbandono, un aspetto in cui Tableau non è specializzato. Con i suoi strumenti di analisi dei funnel, puoi scomporre i percorsi degli utenti, segmentarli in base al comportamento e identificare i punti di attrito in tempo reale. Le funzionalità di analisi dei percorsi e della fidelizzazione di Amplitude aiutano inoltre a comprendere in che modo le modifiche apportate al prodotto influiscono sul flusso e sul coinvolgimento degli utenti.
Funzionalità principali di Amplitude
Alcune altre funzionalità di Amplitude che gli acquirenti di soluzioni di analisi potrebbero voler conoscere includono:
- Segmentazione degli eventi: Analizza e confronta le azioni degli utenti tra segmenti e intervalli di tempo diversi.
- Dashboard personalizzate: Crea e condividi dashboard personalizzati in base alle metriche specifiche del tuo team.
- Strumenti di governance dei dati: Gestisci la qualità dei dati, la tassonomia e i controlli di accesso all'interno della piattaforma.
- Analisi predittiva: Utilizza modelli di apprendimento automatico per prevedere il comportamento e i risultati degli utenti.
Integrazioni di Amplitude
Le integrazioni includono Twilio Segment, Braze, Amazon, HubSpot, Google Search Console, Google Ads, Hotjar, LaunchDarkly, Mailchimp, Marketo, Notion, Salesforce CRM e altro ancora.
Pros and Cons
Pros:
- Analisi avanzata dei dati di prodotto con informazioni dettagliate sui funnel comportamentali
- Analisi self-service per gli utenti aziendali che esplorano i percorsi degli utenti
- Piattaforma cloud scalabile progettata per startup in rapida crescita e team SaaS
Cons:
- Opzioni di visualizzazione meno flessibili rispetto agli strumenti di business intelligence tradizionali
- Le funzionalità avanzate possono richiedere una configurazione tecnica e una gestione continuativa
Sisense
Ideale per le analisi integrate nelle applicazioni

Per i team che desiderano aggiungere analisi direttamente ai propri prodotti o portali, Sisense offre una piattaforma flessibile per le analisi integrate. È particolarmente utile per i fornitori di software, le piattaforme di e-commerce e i team che si occupano di prodotti digitali e desiderano offrire agli utenti dashboard e report interattivi all'interno delle proprie applicazioni. A differenza di Tableau, Sisense è progettato per supportare un'integrazione profonda e la personalizzazione con il proprio marchio, consentendo di fornire analisi come parte della propria esperienza con il marchio.
Perché Sisense è una buona alternativa a Tableau
Se hai bisogno di analisi che risiedano all'interno del tuo prodotto o portale clienti, Sisense è progettato appositamente per le analisi integrate nelle applicazioni. Apprezzo il fatto che Sisense offra un set completo di strumenti e API per sviluppatori, così da poter personalizzare dashboard, report e visualizzazioni in modo da adattarli al tuo marchio e all'esperienza utente. La piattaforma supporta inoltre la personalizzazione con il proprio marchio, consentendoti di presentare le analisi come una parte integrante del tuo software. Questo rende Sisense una valida alternativa a Tableau per i team che desiderano fornire analisi direttamente agli utenti finali all'interno del proprio ambiente.
Funzionalità principali di Sisense
Altre funzionalità di Sisense che gli acquirenti di soluzioni di analisi potrebbero voler conoscere includono:
- Motore dati elastico: Elabora e analizza in tempo reale grandi volumi di dati provenienti da più fonti.
- Analisi basate sull'IA: Utilizza gli strumenti di IA integrati per generare approfondimenti e automatizzare l'esplorazione dei dati.
- Modellazione dei dati personalizzata: Crea e gestisci modelli di dati complessi direttamente all'interno della piattaforma.
- Controlli degli accessi basati sui ruoli: Assegna autorizzazioni e gestisci l'accesso degli utenti a dati sensibili e dashboard.
Integrazioni di Sisense
Le integrazioni includono Salesforce, Google Analytics, Snowflake, Amazon Redshift, Google BigQuery, Azure SQL, MySQL e PostgreSQL.
Pros and Cons
Pros:
- Analisi integrate per prodotti SaaS e portali clienti
- Scalabilità per grandi aziende che forniscono analisi a numerosi utenti
- Implementazione su piattaforma cloud con API per l'integrazione della business intelligence
Cons:
- L'implementazione e la configurazione possono richiedere molto tempo
- I modelli di prezzo sono generalmente pensati per implementazioni su scala aziendale

Ideale per l'acquisizione automatica dei dati degli eventi
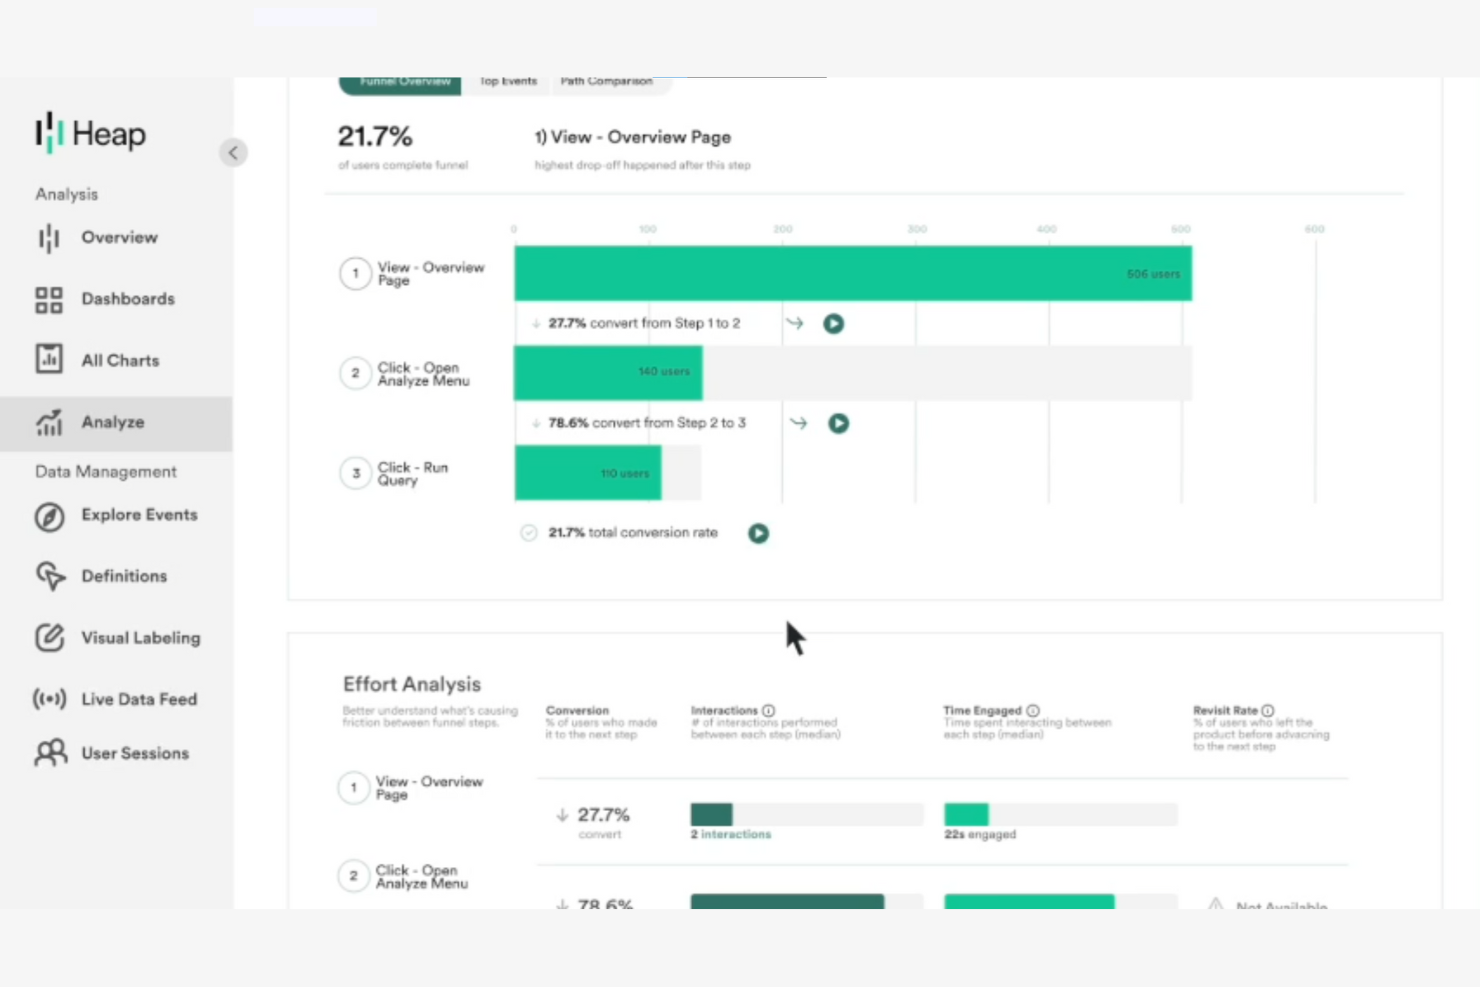
A differenza della maggior parte delle piattaforme di analisi, Heap acquisisce automaticamente ogni interazione degli utenti sul tuo sito web o sulla tua app senza etichettatura manuale. Questo lo rende particolarmente interessante per i team di ecommerce, prodotto e UX che desiderano analizzare i percorsi degli utenti e identificare i punti di attrito con una configurazione minima. Se cerchi un software di analisi che riduca le lacune nel tracciamento e faccia emergere rapidamente informazioni sul comportamento degli utenti, Heap offre un approccio unico rispetto a Tableau e ad altri strumenti.
Perché Heap è una buona alternativa a Tableau
Ciò che distingue Heap da Tableau è la sua capacità di acquisire automaticamente ogni evento degli utenti sul tuo sito web o sulla tua app senza richiedere l'etichettatura manuale. Ho scelto Heap per i team che desiderano analizzare in dettaglio il comportamento degli utenti senza l'onere di configurare ogni evento. La funzionalità di acquisizione automatica di Heap registra clic, invii di moduli e visualizzazioni di pagina fin da subito, così non perdi mai le interazioni chiave. Questo lo rende una scelta eccellente per chiunque abbia bisogno di dati comportamentali granulari con una configurazione minima.
Funzionalità principali di Heap
Altre funzionalità di Heap che i team di analisi potrebbero trovare utili includono:
- Riproduzione delle sessioni: Guarda registrazioni anonime delle sessioni degli utenti per vedere esattamente come i visitatori interagiscono con il tuo sito o la tua app.
- Analisi retroattiva: Analizza i dati storici per nuovi eventi o proprietà senza dover applicare nuovamente i tag o reimplementare il tracciamento.
- Arricchimento dei dati: Combina i dati degli eventi acquisiti con gli attributi degli utenti provenienti dal tuo CRM o da altri sistemi per un'analisi più approfondita.
- Mappe dei percorsi: Visualizza i percorsi completi degli utenti attraverso più sessioni per identificare i comportamenti comuni e i punti di abbandono.
Integrazioni di Heap
Le integrazioni includono LaunchDarkly, Looker Studio, Stripe, Mailchimp, Shopify, Klaviyo, Braze, Marketo, SendGrid, Zapier, JumpCloud e altro ancora.
Pros and Cons
Pros:
- Il tracciamento automatico degli eventi semplifica l'analisi dei dati per i team di prodotto
- L'analisi retroattiva consente agli utenti aziendali di esplorare i dati storici
- La piattaforma cloud supporta l'analisi comportamentale per startup e aziende SaaS
Cons:
- I modelli di prezzo non sono trasparenti per le aziende in crescita
- Le funzionalità di visualizzazione sono limitate rispetto agli strumenti di business intelligence dedicati

Countly
Ideale per informazioni in tempo reale sulle app mobili
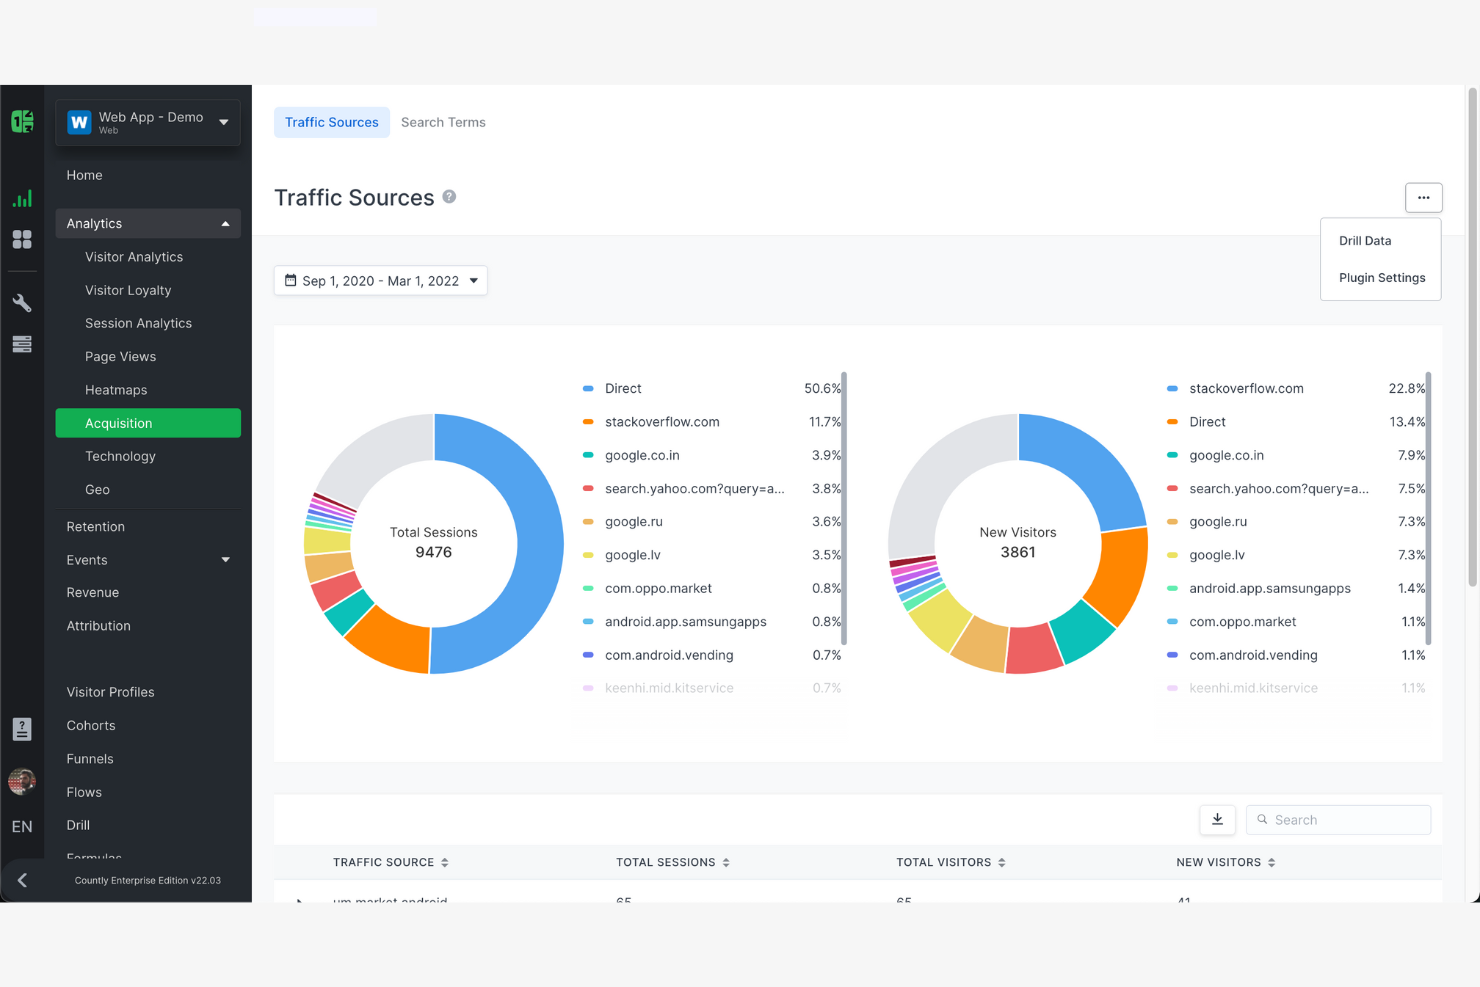
Se hai bisogno di monitorare il comportamento degli utenti e le prestazioni nelle app mobili mentre si verificano, Countly è la soluzione che fa per te. Questa piattaforma è progettata per responsabili di prodotto, sviluppatori di app e team digitali che desiderano informazioni in tempo reale sull'utilizzo e sul coinvolgimento nelle app mobili. A differenza di Tableau, Countly è specializzato nell'analisi delle app mobili e offre il monitoraggio basato sugli eventi e analisi all'interno dell'app che ti aiutano a identificare rapidamente tendenze e problemi mentre gli utenti li sperimentano.
Perché Countly è una buona alternativa a Tableau
Per i team focalizzati sull'analisi delle app mobili, Countly offre funzionalità che Tableau non supporta nativamente. Ho scelto Countly perché fornisce un monitoraggio in tempo reale e basato sugli eventi, consentendo di monitorare le azioni degli utenti e le prestazioni dell'app mentre si verificano. Puoi configurare pannelli di controllo personalizzati per visualizzare gli eventi all'interno dell'app, gli arresti anomali e i flussi degli utenti senza attendere l'elaborazione dei dati in batch. L'attenzione di Countly sulle metriche specifiche per dispositivi mobili lo rende una scelta ottimale per chiunque abbia bisogno di informazioni immediate e utilizzabili sui dati della propria app.
Funzionalità principali di Countly
Alcune altre funzionalità di Countly che chi acquista soluzioni di analisi potrebbe voler conoscere includono:
- Segmentazione degli utenti: Raggruppa gli utenti in base al comportamento, ai dati demografici o alle proprietà personalizzate per un'analisi mirata.
- Modulo di test A/B: Conduci esperimenti all'interno della tua app per confrontare le prestazioni delle funzionalità e la risposta degli utenti.
- Analisi delle notifiche push: Monitora la consegna, i tassi di apertura e il coinvolgimento delle campagne di notifiche push all'interno dell'app.
- Controlli sulla privacy dei dati: Gestisci il consenso degli utenti e le impostazioni di conservazione dei dati per supportare le esigenze di conformità.
Integrazioni di Countly
Le integrazioni includono Okta, Elestio, Zapier, Slack e Salesforce.
Pros and Cons
Pros:
- Analisi dei dati in tempo reale per app mobili e prodotti digitali
- Piattaforma cloud o distribuzione on-premise per una scalabilità flessibile
- Strumenti di segmentazione degli utenti per informazioni sul comportamento e sul coinvolgimento
Cons:
- Funzionalità di visualizzazione meno avanzate rispetto agli strumenti aziendali di analisi dei dati
- La configurazione dei report può richiedere molto tempo per esigenze di analisi complesse

PostHog
Ideale per la flessibilità dell'implementazione autogestita

Per i team che necessitano di un controllo completo sulla propria infrastruttura di analisi, PostHog offre una soluzione flessibile ospitata autonomamente. È particolarmente adatto alle organizzazioni orientate all'ingegneria, alle aziende SaaS e alle imprese attente alla privacy che desiderano implementare l'analisi sui propri server. A differenza di Tableau, PostHog combina analisi del prodotto, registrazione delle sessioni e gestione dei flag delle funzionalità in un'unica piattaforma eseguibile ovunque.
Perché PostHog è una valida alternativa a Tableau
Se hai bisogno di un software di analisi che puoi controllare completamente e implementare sulla tua infrastruttura, PostHog si distingue da Tableau. Ho scelto PostHog perché offre un'opzione di implementazione autogestita, consentendoti di mantenere i dati sensibili in locale o nel tuo cloud privato. La piattaforma include analisi del prodotto, registrazione delle sessioni e gestione dei flag delle funzionalità, tutto gestito all'interno del tuo ambiente. Questa flessibilità è particolarmente preziosa per le aziende con requisiti rigorosi in materia di privacy dei dati o esigenze infrastrutturali personalizzate.
Funzionalità principali di PostHog
Alcune altre funzionalità di PostHog che gli acquirenti di soluzioni di analisi potrebbero voler conoscere includono:
- Acquisizione automatica degli eventi: raccoglie automaticamente le interazioni degli utenti, come clic, visualizzazioni di pagina e invii di moduli, senza etichettatura manuale.
- Analisi delle tendenze: visualizza i cambiamenti nelle metriche principali nel tempo per aiutare a individuare schemi e anomalie.
- Analisi delle coorti: raggruppa gli utenti in base a comportamenti o proprietà condivisi per una segmentazione più approfondita.
- Mercato dei plugin: offre una libreria di plugin per estendere le funzionalità, comprese integrazioni e strumenti di arricchimento dei dati.
Integrazioni di PostHog
PostHog si integra con GitHub, GitLab, Linear e Jira.
Pros and Cons
Pros:
- Piattaforma di analisi a codice aperto con opzioni di implementazione flessibili
- Analisi autonoma per startup e team di prodotto guidati dall'ingegneria
- Analisi dei dati basata sugli eventi con solide funzionalità di monitoraggio comportamentale
Cons:
- Gli strumenti di business intelligence e le funzionalità di visualizzazione sono meno avanzati rispetto a Tableau
- Interfaccia utente meno intuitiva per gli utenti non tecnici
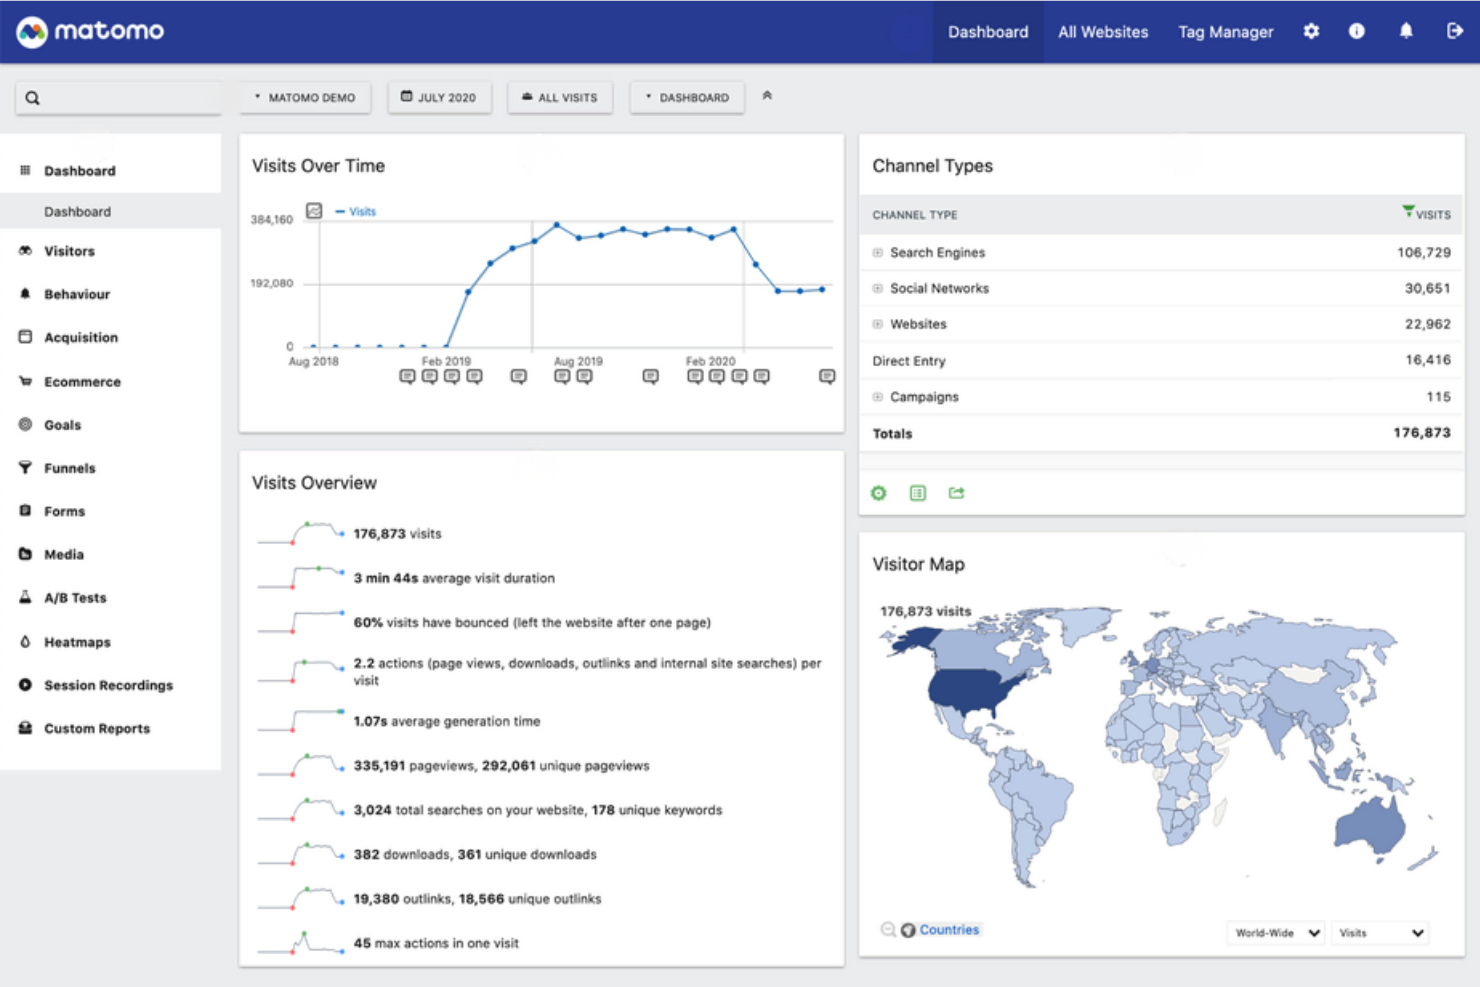
Se hai bisogno di un software di analisi che metta la privacy e la proprietà dei dati al primo posto, vale la pena considerare attentamente Matomo. È progettato per le organizzazioni, in particolare quelle che operano in settori regolamentati o in regioni con leggi severe sulla privacy, che desiderano il pieno controllo sui propri dati di analisi. A differenza di Tableau e di molti altri strumenti di analisi, Matomo ti consente di ospitare i dati sui tuoi server ed evitare il tracciamento da parte di terze parti.
Perché Matomo è una buona alternativa a Tableau
Matomo si distingue da Tableau perché offre il pieno controllo sui dati di analisi e sulla privacy degli utenti. Ho scelto Matomo per i team che devono rispettare rigorose normative sulla privacy o che desiderano evitare la condivisione dei dati con terze parti. Grazie all'hosting locale e agli strumenti integrati per la conformità al GDPR, puoi garantire che i dati sensibili dei clienti non lascino mai il tuo ambiente. Matomo offre inoltre funzionalità incentrate sulla privacy, come il tracciamento senza cookie e la conservazione dei dati personalizzabile, rendendolo una scelta eccellente per le organizzazioni attente alla privacy.
Funzionalità principali di Matomo
Tra le altre funzionalità di Matomo che gli acquirenti di soluzioni di analisi potrebbero voler conoscere troviamo:
- Mappe di calore e registrazioni delle sessioni: visualizza dove gli utenti fanno clic, scorrono e trascorrono il tempo sul tuo sito.
- Dashboard personalizzate: crea dashboard personalizzate con widget per le metriche più importanti per il tuo team.
- Analisi dell'e-commerce: monitora le prestazioni dei prodotti, i tassi di conversione e i ricavi del tuo negozio online.
- Gestore dei tag: gestisci e implementa i tag di marketing e analisi senza modificare il codice del tuo sito.
Integrazioni di Matomo
Le integrazioni includono WordPress, Drupal, Flowpack, Ghost, Shopify, Adobe Commerce, Google Looker Studio, Microsoft Power BI, Slack, Microsoft Teams e altro ancora.
Pros and Cons
Pros:
- Piattaforma di analisi incentrata sulla privacy con pieno controllo sulla proprietà dei dati
- Piattaforma cloud o distribuzione ospitata autonomamente per una scalabilità flessibile
- Strumenti di analisi dei dati per il traffico del sito web, l'e-commerce e il comportamento degli utenti
Cons:
- L'interfaccia utente è meno intuitiva rispetto ai moderni strumenti di business intelligence
- La configurazione avanzata può richiedere molto tempo agli utenti non tecnici

Se la tua azienda si affida già a Microsoft 365, Power BI offre funzionalità di analisi che si integrano perfettamente nei flussi di lavoro esistenti. È particolarmente utile per le organizzazioni che desiderano collegare i dati provenienti da Excel, Teams e SharePoint senza configurazioni aggiuntive. In quanto una delle principali soluzioni di BI autonoma sul mercato, Power BI consente agli utenti aziendali di esplorare i dati, creare cruscotti e generare informazioni utili senza un supporto tecnico significativo. A differenza di Tableau, la profonda integrazione di Power BI con gli strumenti Microsoft semplifica la condivisione dei cruscotti e l'automazione dei resoconti in tutta l'azienda.
Perché Microsoft Power BI è una buona alternativa a Tableau
Per i team che hanno già investito in Microsoft 365, Power BI offre funzionalità di analisi che funzionano in modo nativo con gli strumenti utilizzati ogni giorno. Ho scelto Power BI perché si collega direttamente a Excel, Teams e SharePoint, semplificando l'importazione dei dati e la collaborazione sui resoconti. La piattaforma supporta inoltre l'aggiornamento automatico dei dati e la condivisione tramite l'ambiente cloud sicuro di Microsoft. Questo livello di integrazione aiuta la tua azienda a mantenere analisi e resoconti strettamente allineati alle operazioni quotidiane.
Funzionalità principali di Power BI
Alcune altre funzionalità di Power BI che gli acquirenti di soluzioni di analisi potrebbero voler conoscere includono:
- Strumenti di modellazione dei dati: Crea modelli di dati complessi utilizzando relazioni, colonne calcolate e formule DAX.
- Informazioni basate sull'intelligenza artificiale: Utilizza l'intelligenza artificiale integrata per rilevare tendenze, prevedere risultati e generare riepiloghi in linguaggio naturale.
- Mercato degli elementi visivi personalizzati: Accedi a una libreria di elementi visivi personalizzati per migliorare i cruscotti e i resoconti.
- Sicurezza a livello di riga: Controlla l'accesso ai dati definendo autorizzazioni specifiche per gli utenti all'interno dei resoconti.
Integrazioni di Power BI
Le integrazioni includono Excel, SharePoint, Microsoft Teams, Azure SQL Database, Dynamics 365, Salesforce, Google Analytics, SAP HANA, Oracle Database e GitHub.
Pros and Cons
Pros:
- Strumenti di intelligence aziendale integrati nell'ecosistema Microsoft 365
- Analisi autonoma con un'interfaccia intuitiva per gli utenti aziendali
- Piattaforma cloud scalabile che supporta nuove imprese e grandi aziende
Cons:
- La modellazione DAX comporta una curva di apprendimento ripida per i nuovi utenti
- Alcune funzionalità avanzate sono limitate ai piani tariffari più costosi


Se il tuo team ha bisogno di cruscotti che corrispondano esattamente alle tue metriche aziendali, Grow ti offre il pieno controllo su come visualizzare e organizzare i tuoi dati. È particolarmente adatto ai team del settore della vendita al dettaglio e del commercio elettronico che desiderano combinare dati provenienti da più fonti e progettare cruscotti personalizzati in base ai propri KPI. A differenza di Tableau, Grow pone l'accento sulla personalizzazione senza codice e su layout flessibili dei cruscotti, consentendoti di adattare l'analisi ai tuoi flussi di lavoro specifici.
Perché Grow è una buona alternativa a Tableau
Ciò che distingue Grow come alternativa a Tableau è la sua attenzione alla creazione di cruscotti personalizzabili per i team che desiderano analisi adattate alla propria attività. Apprezzo il fatto che Grow permetta di creare cruscotti da zero utilizzando un editor con trascinamento, così puoi disporre grafici, tabelle e visualizzazioni esattamente come preferisci. La piattaforma supporta inoltre calcoli e metriche personalizzati, permettendoti di definire i KPI più importanti per la tua attività. Questa flessibilità rende Grow una scelta valida se hai bisogno di cruscotti che si adattino alle tue specifiche esigenze di rendicontazione.
Funzionalità principali di Grow
Alcune altre funzionalità di Grow che gli acquirenti di soluzioni di analisi potrebbero voler conoscere includono:
- Combinazione dei dati: Combina dati provenienti da più fonti in un'unica visualizzazione del cruscotto.
- Rapporti via e-mail programmati: Invia automaticamente istantanee dei cruscotti ai membri del team secondo una pianificazione prestabilita.
- Connettori dati predefiniti: Collegati rapidamente a fonti di dati popolari come Shopify, Salesforce e Google Analytics.
- Gestione delle autorizzazioni degli utenti: Imposta diversi livelli di accesso per gli utenti per controllare chi può visualizzare o modificare i cruscotti.
Integrazioni di Grow
Le integrazioni includono Salesforce, Google Analytics, Shopify, HubSpot, QuickBooks, Stripe, Google Sheets e MySQL.
Pros and Cons
Pros:
- Interfaccia intuitiva progettata per gli utenti non tecnici che creano cruscotti
- Strumenti di analisi autonomi per piccole imprese e startup
- La configurazione rapida riduce i tempi di sviluppo dei rapporti
Cons:
- I modelli di prezzo non sono completamente trasparenti senza contattare il team commerciale
- Funzionalità avanzate limitate rispetto agli strumenti aziendali di analisi dei dati
Altre alternative a Tableau
Ecco alcune ulteriori alternative a Tableau che non sono state incluse nel mio elenco ristretto, ma che vale comunque la pena prendere in considerazione:
- SAS
Ideale per la modellazione statistica avanzata
- Paylocity
Ideale per l'integrazione dell'analisi della forza lavoro
- Qlik Sense
Ideale per l'esplorazione associativa


Come Valuto le Alternative a Tableau
Divido le valutazioni in due livelli: le capacità fondamentali che rendono uno strumento una vera alternativa a Tableau e i fattori di differenziazione come i connettori specifici per il retail o i dati POS in tempo reale che distinguono i migliori.
Funzionalità di Base (Requisiti Minimi per Questa Lista)
Quando seleziono gli strumenti per la mia lista, valuto ciascuno su una scala da 0 (non offre la funzionalità) a 5 (eccelle in quest'area) per ogni funzionalità di base elencata qui sotto. Poi calcolo il punteggio totale dello strumento in percentuale. Ogni strumento deve ottenere un punteggio totale minimo del 65% per essere considerato.
- Visualizzazione Interattiva dei Dati: Valuto l'ampiezza delle tipologie di grafici e dell'interattività—approfondimenti, filtri incrociati e dettagli al passaggio del mouse che permettono a un analista del merchandising di passare da una panoramica delle vendite regionali alle performance SKU a livello di punto vendita con pochi clic.
- Connettività Multi-Sorgente dei Dati: I dati nel retail risiedono in silos POS, ERP, ecommerce e fogli di calcolo, quindi verifico la presenza di connettori nativi per sistemi come Shopify, NetSuite e data warehouse cloud come Snowflake o BigQuery.
- Analisi Self-Service: Cerco la creazione di report drag-and-drop e l'esplorazione guidata che un category manager può utilizzare per rispondere a domande ad hoc sulle marginalità senza dover inviare una richiesta al team dati.
- Condivisione & Collaborazione su Dashboard: La distribuzione è fondamentale tra negozi e regioni, quindi valuto la reportistica programmata, la condivisione basata sui ruoli, i commenti e le opzioni di dashboard incorporati che mantengono allineati tutti gli stakeholder.
- Data Modeling & Trasformazione: Unire le transazioni POS con i flussi di inventario e i calendari promozionali richiede join, campi calcolati e idealmente un livello semantico riutilizzabile—verifico come ciascuno strumento gestisce questa preparazione.
- Opzioni di Deployment Scalabili: Considero se uno strumento supporta il cloud, installazione on-premise o ibrida insieme a gestione degli accessi basata sui ruoli e sicurezza a livello di riga, adatte a organizzazioni retail multi-sede con team regionali distinti.
Dopo aver selezionato gli strumenti che soddisfano questi criteri, considero ciò che distingue ogni piattaforma.
Fattori Differenzianti (Cosa Distingue i Vendor)
Ecco come confronto le diverse soluzioni:
Funzionalità Distintive
Le analisi potenziate dall'IA sono un criterio chiave di differenziazione. Gli strumenti che evidenziano anomalie nei tassi di sell-through o segnalano cali inaspettati nell'inventario danno agli analisti un vantaggio rispetto all'analisi manuale dei report. Valuto anche l'analitica mobile, poiché i responsabili di negozio hanno bisogno di accedere ai KPI di vendita e personale senza aprire un laptop. Lo streaming dati in tempo reale è fondamentale nei picchi stagionali, quando i feed POS live aiutano i team operativi a reagire a esaurimenti di scorte o all'andamento delle promozioni durante lo stesso turno.
Oltre le Funzionalità
Valuto con attenzione il costo totale di proprietà. Le licenze per utente possono crescere rapidamente se si offrono dashboard a centinaia di responsabili di negozio, quindi confronto i modelli di prezzo per vedere quali si adattano meglio a team retail numerosi con molti visualizzatori. Sono importanti anche le integrazioni con l'ecosistema tecnologico retail—uno strumento che si collega nativamente a POS, ERP ed ecommerce riduce il carico di lavoro per l'ingegnerizzazione dei dati. Inoltre, prendo in esame la governance e la compliance, in particolare rispetto a PCI DSS e alla gestione dei dati dei clienti, poiché l'analisi dei dati nel retail spesso implica il trattamento di dati transazionali sensibili.
Perché cercare un'alternativa a Tableau?
Sebbene Tableau sia una buona scelta per il software di analisi, esistono diversi motivi per cui alcuni utenti cercano soluzioni alternative. Potresti essere alla ricerca di un'alternativa a Tableau perché…
- Hai bisogno di integrare le analisi direttamente nelle tue applicazioni
- Il tuo team necessita di funzionalità più avanzate di modellazione dei dati
- Desideri opzioni di prezzo più trasparenti o flessibili
- Hai bisogno di un supporto migliore per i dati in tempo reale o in streaming
- La tua organizzazione necessita di funzionalità di personalizzazione del marchio o di white label
Se ti riconosci in una di queste situazioni, sei nel posto giusto. Il mio elenco contiene diverse opzioni di software di analisi più adatte ai team che affrontano queste difficoltà con Tableau e cercano soluzioni alternative.
Funzionalità principali di Tableau
Ecco alcune delle funzionalità principali di Tableau, che ti aiuteranno a mettere a confronto ciò che offrono le soluzioni alternative:
- Dashboard e creazione di report con trascinamento
- Ampia gamma di opzioni per la visualizzazione dei dati
- Supporto per connessioni dati in tempo reale e pianificate
- Funzionalità di filtraggio interattivo e analisi dettagliata
- Strumenti integrati per la preparazione e la pulizia dei dati
- Funzionalità di collaborazione e condivisione per i team
- Dashboard e report ottimizzati per dispositivi mobili
- Integrazione con Salesforce e altre piattaforme principali
- Analisi avanzate con campi calcolati e previsioni
- Controlli degli accessi basati sui ruoli per la sicurezza dei dati
Prossimi passi:
Se stai valutando alternative a Tableau, contatta gratuitamente un consulente di SoftwareSelect per ricevere consigli.
Compili un modulo e fai una breve conversazione durante la quale vengono analizzati nel dettaglio i tuoi requisiti. Successivamente riceverai una selezione ristretta di software da esaminare. Ti supporteranno anche durante l'intero processo di acquisto, comprese le negoziazioni sul prezzo.