

Le 10 migliori alternative a Looker per la reportistica retail nel 2026

Selezione di alternative a Looker


Una valida alternativa a Looker offre al tuo team una modellazione dei dati flessibile, dashboard intuitive e un'integrazione affidabile con le fonti di dati esistenti. Se stai cercando le migliori alternative a Looker, probabilmente stai valutando costi, facilità d'uso, scalabilità o funzionalità analitiche specifiche più adatte alla tua attività.
Con così tante piattaforme di BI disponibili, è difficile sapere quali strumenti supporteranno davvero le tue esigenze di reporting, collaborazione ed esplorazione dei dati. Questo elenco ti aiuterà a confrontare rapidamente le migliori alternative a Looker per il 2026, così potrai trovare la soluzione di analisi più adatta agli obiettivi e ai flussi di lavoro del tuo team.
Che cos'è Looker?
Looker è uno strumento di business intelligence che aiuta i team a esplorare, analizzare e condividere informazioni dettagliate sui dati in tempo reale. Si connette a diverse fonti di dati e utilizza un linguaggio di modellazione chiamato LookML per creare report e dashboard personalizzati. Looker viene spesso utilizzato da team che si occupano di dati, analisti e utenti aziendali che necessitano di funzionalità analitiche avanzate per visualizzare le tendenze, monitorare i KPI e supportare decisioni migliori in tutta l'organizzazione. Sebbene offra solide funzionalità analitiche, alcuni team ritengono che la curva di apprendimento sia più ripida rispetto ad altri strumenti, che dispongono di un'interfaccia più intuitiva basata sul trascinamento e rilascio o di strumenti di visualizzazione più facili da usare.
Riepilogo delle migliori alternative a Looker
Questo grafico comparativo riassume i dettagli sui prezzi delle mie principali alternative a Looker, per aiutarti a trovare quella più adatta al tuo budget e alle esigenze della tua attività.
| Tool | Best For | Trial Info | Price | ||
|---|---|---|---|---|---|
| 1 | Ideale per l'analisi visiva interattiva | Prova gratuita + piano gratuito disponibili | A partire da $15/utente/mese (con fatturazione annuale) | Website | |
| 2 | Ideale per la reportistica automatizzata dei dati | Prova gratuita di 14 giorni + demo gratuita disponibile | A partire da $800/10 utenti/mese (fatturazione biennale) | Website | |
| 3 | Ideale per dashboard KPI in tempo reale | Piano gratuito + prova gratuita di 14 giorni + demo gratuita disponibile | A partire da $71/mese (con fatturazione annuale) | Website | |
| 4 | Ideale per l'integrazione dei dati cloud | Prova gratuita di 30 giorni + demo gratuita disponibile | Prezzi su richiesta | Website | |
| 5 | Ideale per funzionalità di analisi all'interno dell'applicazione | Demo gratuita disponibile | Prezzi su richiesta | Website | |
| 6 | Ideale per l'integrazione con Microsoft 365 | Piano gratuito disponibile | A partire da £10.80/utente/mese (con fatturazione annuale) | Website | |
| 7 | Ideale per la personalizzazione open source | Piano gratuito disponibile | Da $90/mese (con fatturazione annuale) | Website | |
| 8 | Ideale per l'analisi integrata nelle app | Prova gratuita di 7 giorni + demo gratuita disponibile | Prezzi su richiesta | Website | |
| 9 | Ideale per analisi basate sulla ricerca | Prova gratuita di 14 giorni + demo gratuita disponibile | A partire da $25/utente/mese (con fatturazione annuale) | Website | |
| 10 | Ideale per l'esplorazione associativa dei dati | Prova gratuita di 30 giorni + demo gratuita disponibile | A partire da $300/10 utenti/mese | Website |
Perché fidarsi dei nostri consigli sui software
Il nostro team testa e recensisce software dal 2012. In quanto leader del retail noi stessi, sappiamo quanto sia difficile — e importante — scegliere il software giusto.
Per questa guida, abbiamo valutato gli strumenti attraverso test pratici e ricerche indipendenti, assegnando un punteggio agli strumenti in base ai nostri criteri di selezione.
Le nostre recensioni riflettono il nostro giudizio indipendente, non un discorso di vendita.
Recensioni delle alternative a Looker
Di seguito trovi i miei riepiloghi dettagliati delle alternative a Looker incluse nella mia selezione. Le mie recensioni offrono una panoramica approfondita delle funzionalità, dei migliori casi d’uso e delle integrazioni di ciascuna piattaforma, per aiutarti a trovare quella più adatta alla tua attività.
Tableau
Ideale per l'analisi visiva interattiva
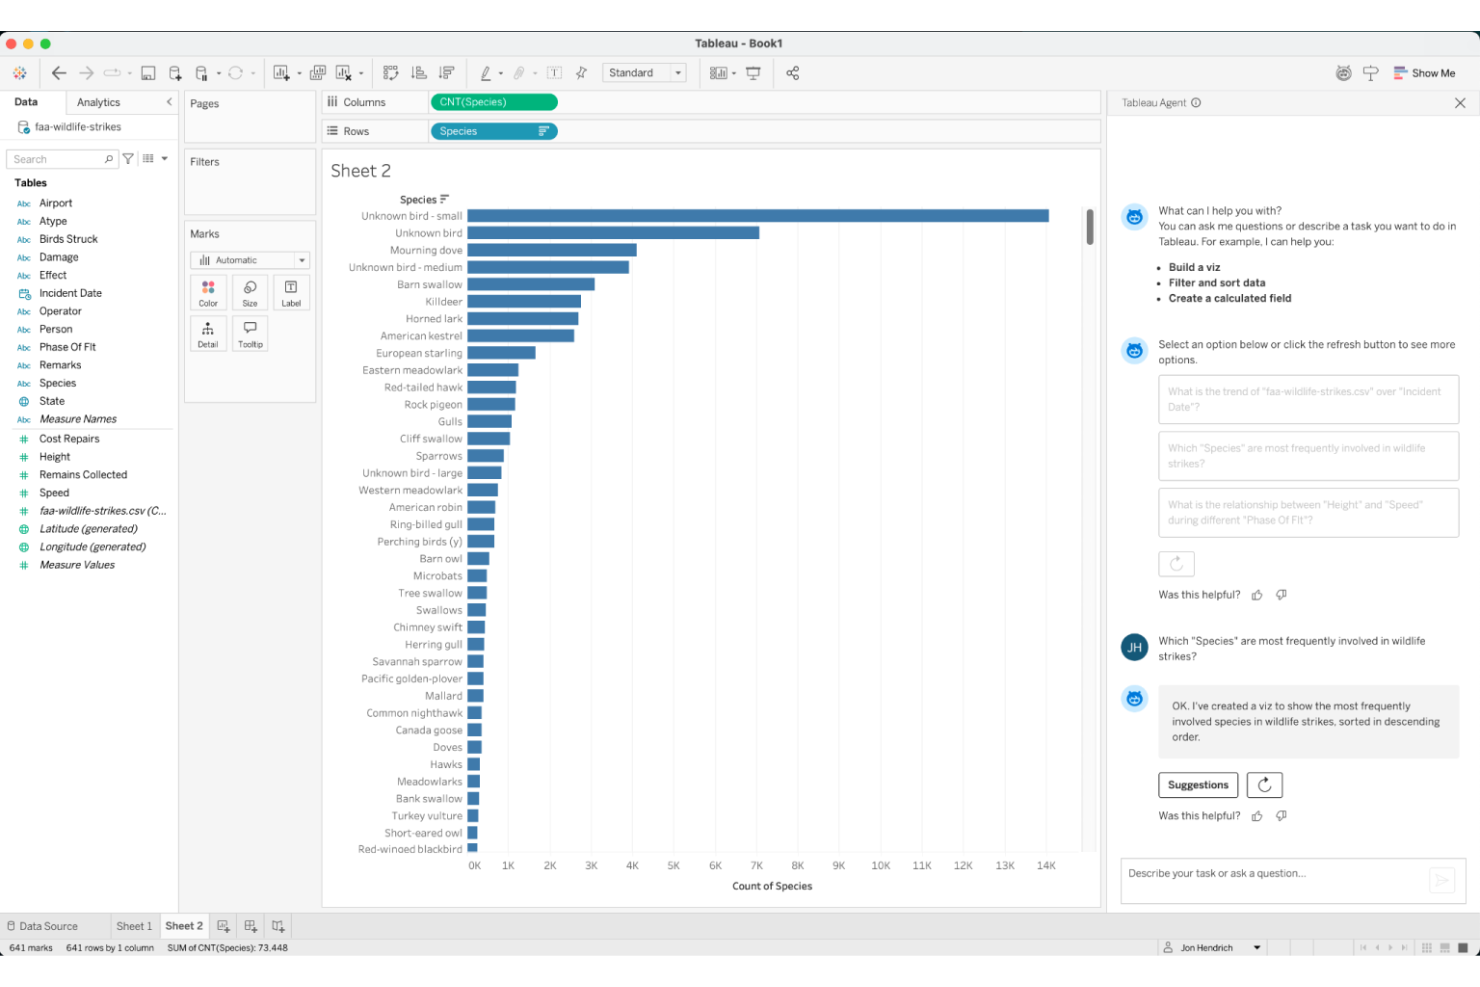
Tableau si distingue per i team che necessitano di analisi altamente interattive e visivamente ricche. È particolarmente adatto ai professionisti della vendita al dettaglio, dell'e-commerce e delle operazioni che desiderano approfondire le tendenze dei dati e creare dashboard personalizzate senza ricorrere a una programmazione complessa. Se cerchi visualizzazioni flessibili con funzionalità di trascinamento e rilascio e un'esplorazione rapida dei dati, Tableau offre un approccio diverso rispetto al flusso di lavoro di Looker incentrato sulla modellazione.
Perché Tableau è una valida alternativa a Looker
La forza di Tableau nell'analisi visiva interattiva lo rende una scelta interessante per i team che desiderano esplorare i dati visivamente e scoprire rapidamente nuove informazioni. Ho scelto Tableau perché il suo strumento per la creazione di dashboard con funzionalità di trascinamento e rilascio e i suoi strumenti di filtraggio dinamico consentono agli utenti di manipolare i dati in tempo reale, risultando ideali per i team della vendita al dettaglio e dell'e-commerce che monitorano metriche in rapida evoluzione. L'ampia gamma di tipi di grafici e le funzionalità di mappatura della piattaforma supportano inoltre una narrazione visiva approfondita dei dati. Se devi presentare informazioni complesse in modo facile da comprendere e su cui agire, Tableau offre un'esperienza diversa rispetto all'approccio basato sul codice di Looker.
Funzionalità principali di Tableau
Alcune altre funzionalità di Tableau che potrebbero interessare il tuo team includono:
- Preparazione dei dati con Tableau Prep: prepara, pulisci e struttura visivamente i dati prima dell'analisi utilizzando l'interfaccia del flusso di lavoro di Tableau Prep.
- Aggiornamenti pianificati dei dati: configura aggiornamenti automatici dei dati per mantenere dashboard e report aggiornati con le informazioni più recenti.
- Sicurezza a livello di riga: controlla l'accesso ai dati sensibili impostando autorizzazioni a livello di riga per utenti o gruppi diversi.
- Dashboard ottimizzate per dispositivi mobili: crea dashboard che si adattano automaticamente ai dispositivi mobili, consentendo agli utenti di accedere alle informazioni ovunque si trovino.
Integrazioni di Tableau
Le integrazioni includono Salesforce, Google Analytics, Amazon Redshift, Microsoft Excel, Snowflake, Google BigQuery, Oracle, SAP, MySQL e PostgreSQL.
Pros and Cons
Pros:
- Si connette a un'ampia gamma di fonti di dati oltre all'analisi web
- Offre opzioni avanzate di visualizzazione dei dati e personalizzazione delle dashboard
- Supporta la combinazione di dati online e offline per un'analisi completa
Cons:
- Richiede una configurazione separata per il monitoraggio dei siti web rispetto a Google Analytics
- Non dispone della modellazione integrata dell'attribuzione di marketing presente in alcuni strumenti di analisi
Ideale per la reportistica automatizzata dei dati
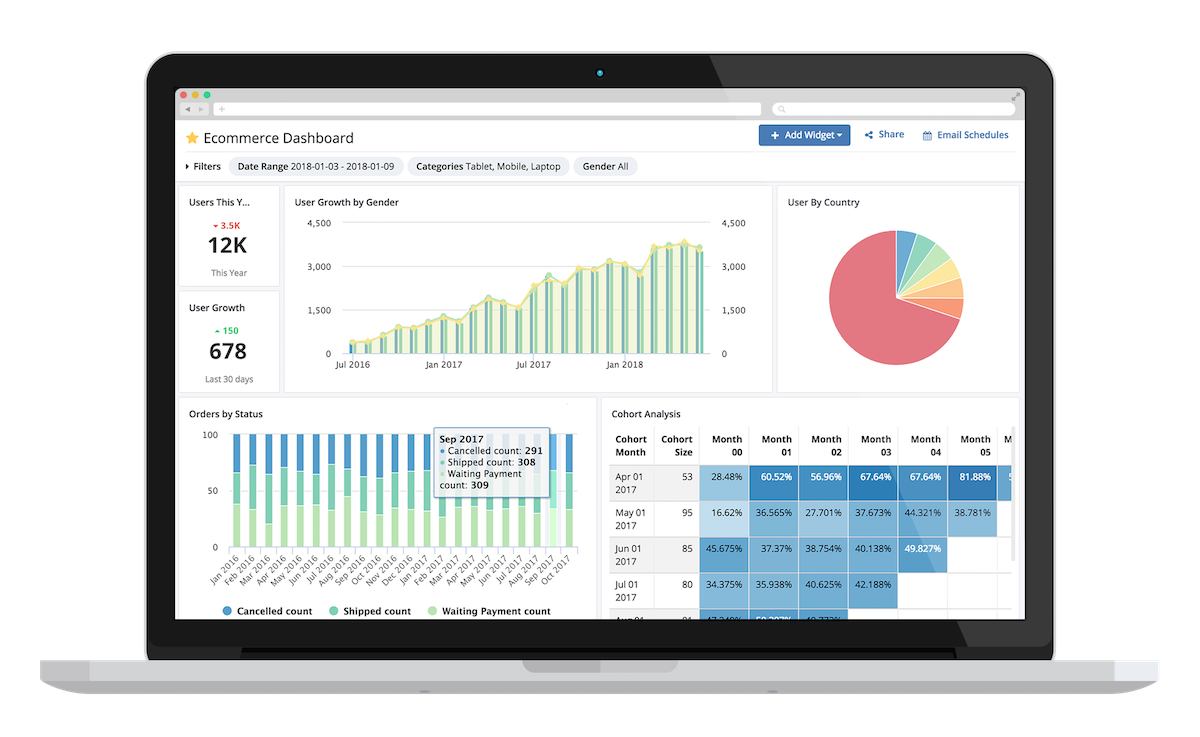
Holistics è progettato per i team che desiderano automatizzare la reportistica dei dati e ridurre il lavoro manuale di analisi. È particolarmente utile per le attività di ecommerce e vendita al dettaglio che devono fornire report ricorrenti e programmati a più stakeholder. A differenza di Looker, Holistics pone l'accento sulla modellazione dei dati basata sul codice e sulla distribuzione automatizzata dei report, risultando quindi particolarmente adatto ai team orientati ai dati con esigenze di reportistica continuative.
Perché Holistics è una buona alternativa a Looker
Se stai cercando una piattaforma di business intelligence che dia priorità alla reportistica automatizzata dei dati, vale la pena prendere in considerazione Holistics. Ho scelto Holistics perché consente di programmare e distribuire report ricorrenti direttamente via email, Slack o altri canali senza intervento manuale. Il livello di modellazione dei dati della piattaforma utilizza il codice, permettendo di definire logiche riutilizzabili e automatizzare flussi di lavoro di reportistica complessi. Per i team che devono mantenere gli stakeholder aggiornati con dati regolarmente aggiornati, Holistics offre funzionalità di automazione che vanno oltre quelle disponibili direttamente in Looker.
Funzionalità principali di Holistics
Alcune delle altre funzionalità che rendono Holistics interessante includono:
- Esplorazione self-service dei dati: Consente agli utenti di esplorare e visualizzare i dati senza scrivere query SQL.
- Integrazione con il controllo delle versioni: Gestisci i modelli di dati e le modifiche utilizzando flussi di lavoro basati su Git.
- Sicurezza a livello di riga: Limita l'accesso ai dati in base ai ruoli e alle autorizzazioni degli utenti.
- Pipeline di trasformazione dei dati: Crea e programma processi di trasformazione dei dati direttamente all'interno della piattaforma.
Integrazioni di Holistics
Le integrazioni includono Snowflake, Google BigQuery, Amazon Redshift, MySQL, PostgreSQL, Amazon Athena, ClickHouse, Presto, SQL Server e Databricks.
Pros and Cons
Pros:
- La modellazione basata su SQL supporta flussi di lavoro complessi sui dati
- La logica dei dati centralizzata migliora la coerenza della reportistica
- I connettori dati integrati riducono la necessità di collegarsi a più database
Cons:
- La documentazione e le risorse della community sono meno mature rispetto a quelle di Looker
- Le funzionalità avanzate di interattività dei dashboard non sono sviluppate in modo altrettanto completo

Databox
Ideale per dashboard KPI in tempo reale
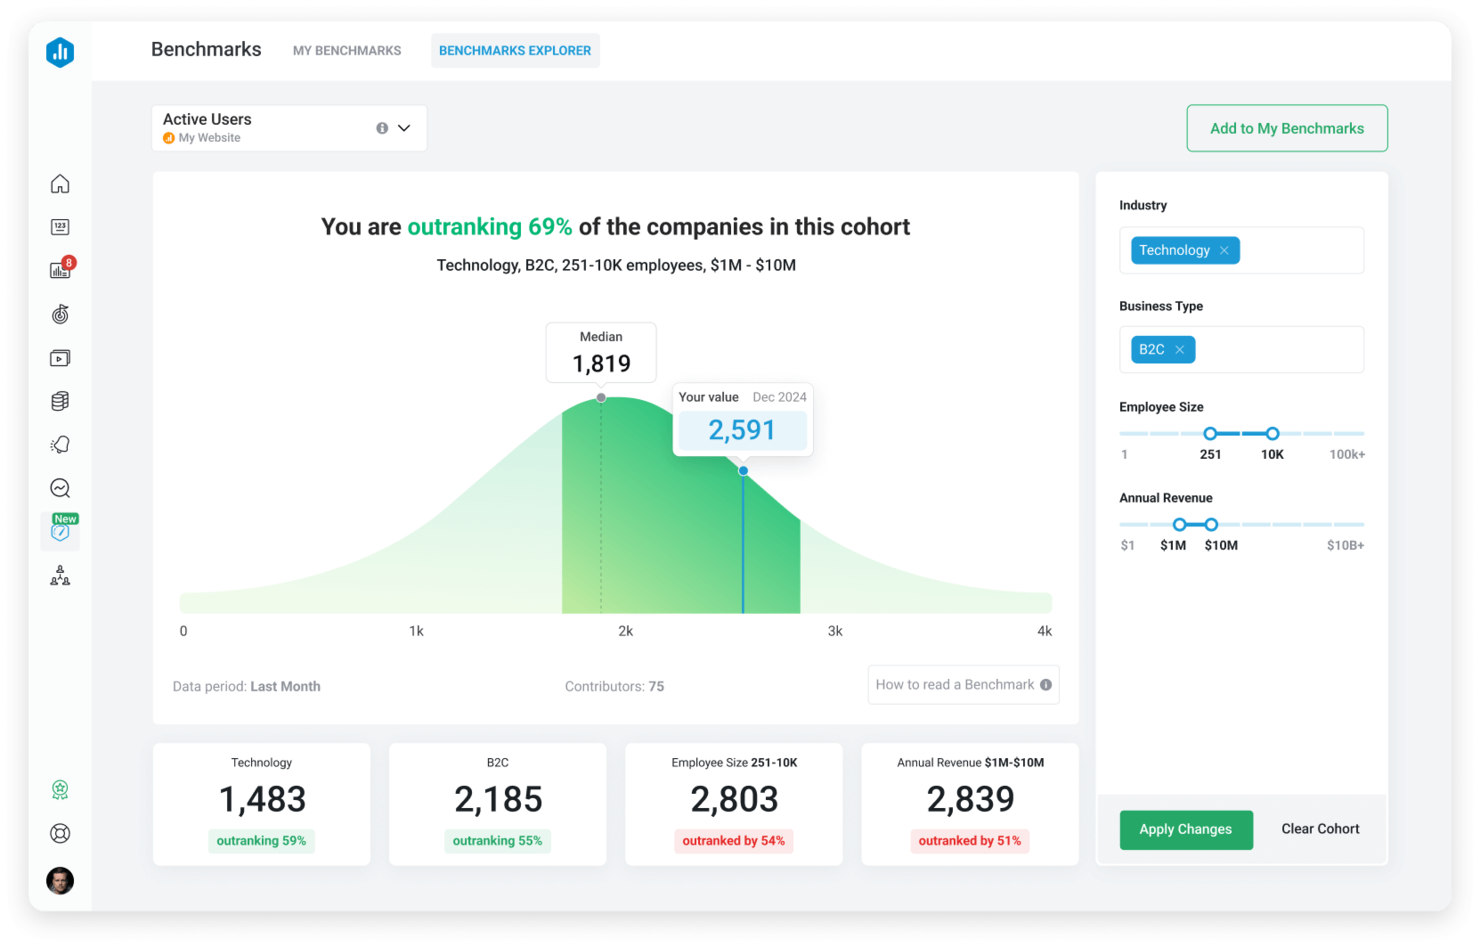
Databox è progettato per i team che hanno bisogno di visibilità in tempo reale sugli indicatori chiave delle prestazioni provenienti da più fonti di dati. È particolarmente utile per i professionisti dell'e-commerce, della vendita al dettaglio e del marketing che desiderano monitorare le metriche in tempo reale e individuare le tendenze non appena si manifestano. A differenza di Looker, Databox si concentra sulla creazione rapida di dashboard e sulla sincronizzazione istantanea dei dati, rendendo più semplice tenere sotto controllo le prestazioni aziendali senza attendere i report programmati.
Perché Databox è una buona alternativa a Looker
Per i team che hanno bisogno di informazioni aggiornate al minuto, Databox si distingue per le sue dashboard KPI in tempo reale. Ho scelto Databox perché consente di collegare decine di fonti di dati e visualizzare aggiornamenti in tempo reale su un'unica dashboard, evitando di dover attendere gli aggiornamenti programmati. Il generatore di dashboard con funzionalità di trascinamento rende semplice visualizzare e monitorare le metriche mentre cambiano nel corso della giornata. Se desideri monitorare le prestazioni aziendali in tempo reale, Databox offre un livello di immediatezza che Looker non riesce a eguagliare.
Funzionalità principali di Databox
Alcune delle altre funzionalità che rendono Databox interessante includono:
- Monitoraggio degli obiettivi: Imposta, monitora e visualizza i progressi verso obiettivi aziendali specifici.
- Accesso tramite app mobile: Visualizza le dashboard e ricevi avvisi sui dispositivi iOS e Android.
- Calcoli sui dati: Crea metriche personalizzate combinando dati provenienti da più fonti.
- Istantanee programmate: Invia automaticamente istantanee delle dashboard al tuo team tramite e-mail o Slack.
Integrazioni di Databox
Le integrazioni includono Google Analytics, HubSpot, Facebook Ads, Shopify, Instagram Business, LinkedIn, X Ads, Salesforce, Mailchimp, QuickBooks e altro.
Pros and Cons
Pros:
- Gli aggiornamenti delle dashboard in tempo reale supportano un processo decisionale immediato per i team
- I connettori predefiniti semplificano l'integrazione con i più diffusi strumenti di marketing e vendita
- L'accesso tramite app mobile consente agli utenti di monitorare i KPI ovunque si trovino
Cons:
- Le query SQL personalizzate non sono supportate per analisi avanzate dei dati
- Le opzioni di trasformazione dei dati sono limitate rispetto al livello di modellazione di Looker
Domo
Ideale per l'integrazione dei dati cloud
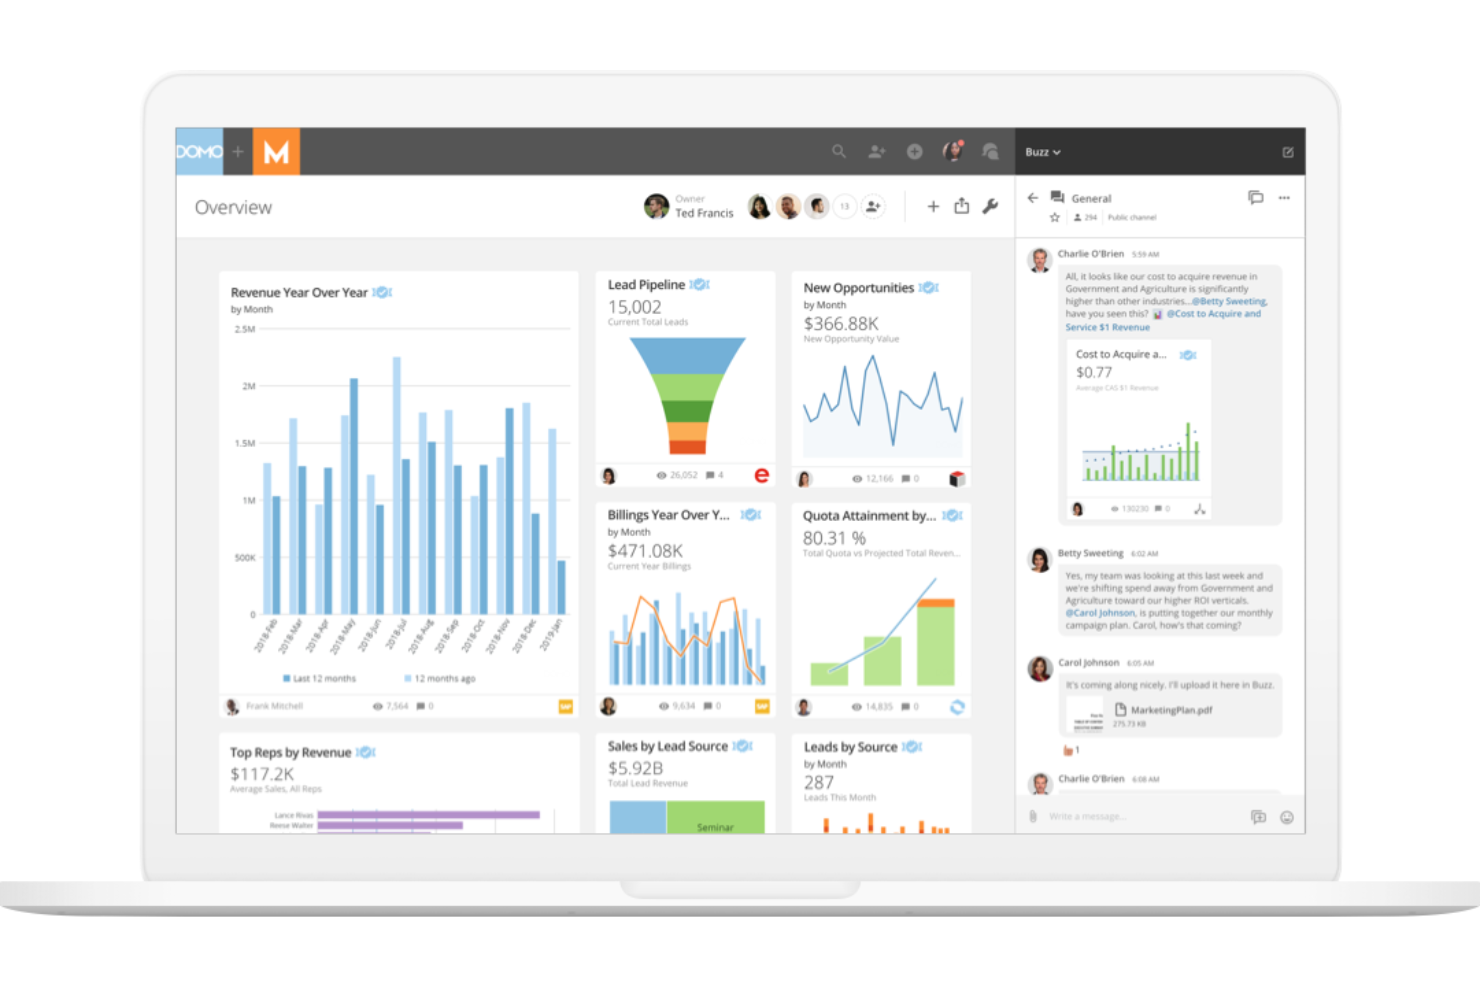
Domo è progettato per le aziende che devono connettere, trasformare e analizzare dati provenienti da un'ampia gamma di fonti cloud. I team del commercio al dettaglio, dell'e-commerce e delle attività operative scelgono spesso Domo per la sua capacità di unificare le pipeline di dati e automatizzare i flussi di lavoro su più piattaforme. A differenza di Looker, Domo pone l'accento sull'integrazione nativa per il cloud e sulla condivisione dei dati in tempo reale, semplificando la centralizzazione degli insight provenienti da sistemi distribuiti.
Perché Domo è una buona alternativa a Looker
Se la tua azienda si basa sulla connessione di dati provenienti da decine di piattaforme cloud, Domo offre un vantaggio unico rispetto a Looker. Ho scelto Domo perché la sua architettura nativa per il cloud consente di estrarre, combinare e analizzare dati da fonti come AWS, Google Cloud e Salesforce senza un forte coinvolgimento dell'IT. La funzionalità Magic ETL di Domo consente di trasformare e preparare visivamente i dati direttamente nella piattaforma, così puoi automatizzare flussi di lavoro complessi e mantenere aggiornate le analisi. Per i team che devono centralizzare e utilizzare rapidamente i dati cloud, le capacità di integrazione di Domo sono difficili da eguagliare.
Funzionalità principali di Domo
Altre funzionalità che rendono Domo interessante includono:
- Studio delle app: crea e distribuisci app di dati personalizzate direttamente all'interno della piattaforma.
- Strumenti di governance dei dati: gestisci le autorizzazioni degli utenti, l'accesso ai dati e i controlli di conformità.
- Avvisi e notifiche: configura avvisi automatici per variazioni o anomalie nelle metriche chiave.
- Analisi integrate: integra dashboard e report di Domo in siti web o applicazioni esterni.
Integrazioni di Domo
Le integrazioni includono Salesforce, Google Analytics, Facebook Ads, Twitter, Instagram, Shopify, HubSpot, Marketo, LinkedIn e Microsoft Dynamics.
Pros and Cons
Pros:
- L'integrazione dei dati nativa per il cloud supporta connessioni in tempo reale a numerose fonti
- Magic ETL consente la trasformazione visiva dei dati senza competenze di programmazione
- Studio delle app consente di creare app di dati personalizzate all'interno della piattaforma
Cons:
- Volumi elevati di dati possono causare prestazioni più lente delle dashboard
- La configurazione iniziale e l'acquisizione dei dati possono richiedere l'assistenza del fornitore
Reveal
Ideale per funzionalità di analisi all'interno dell'applicazione
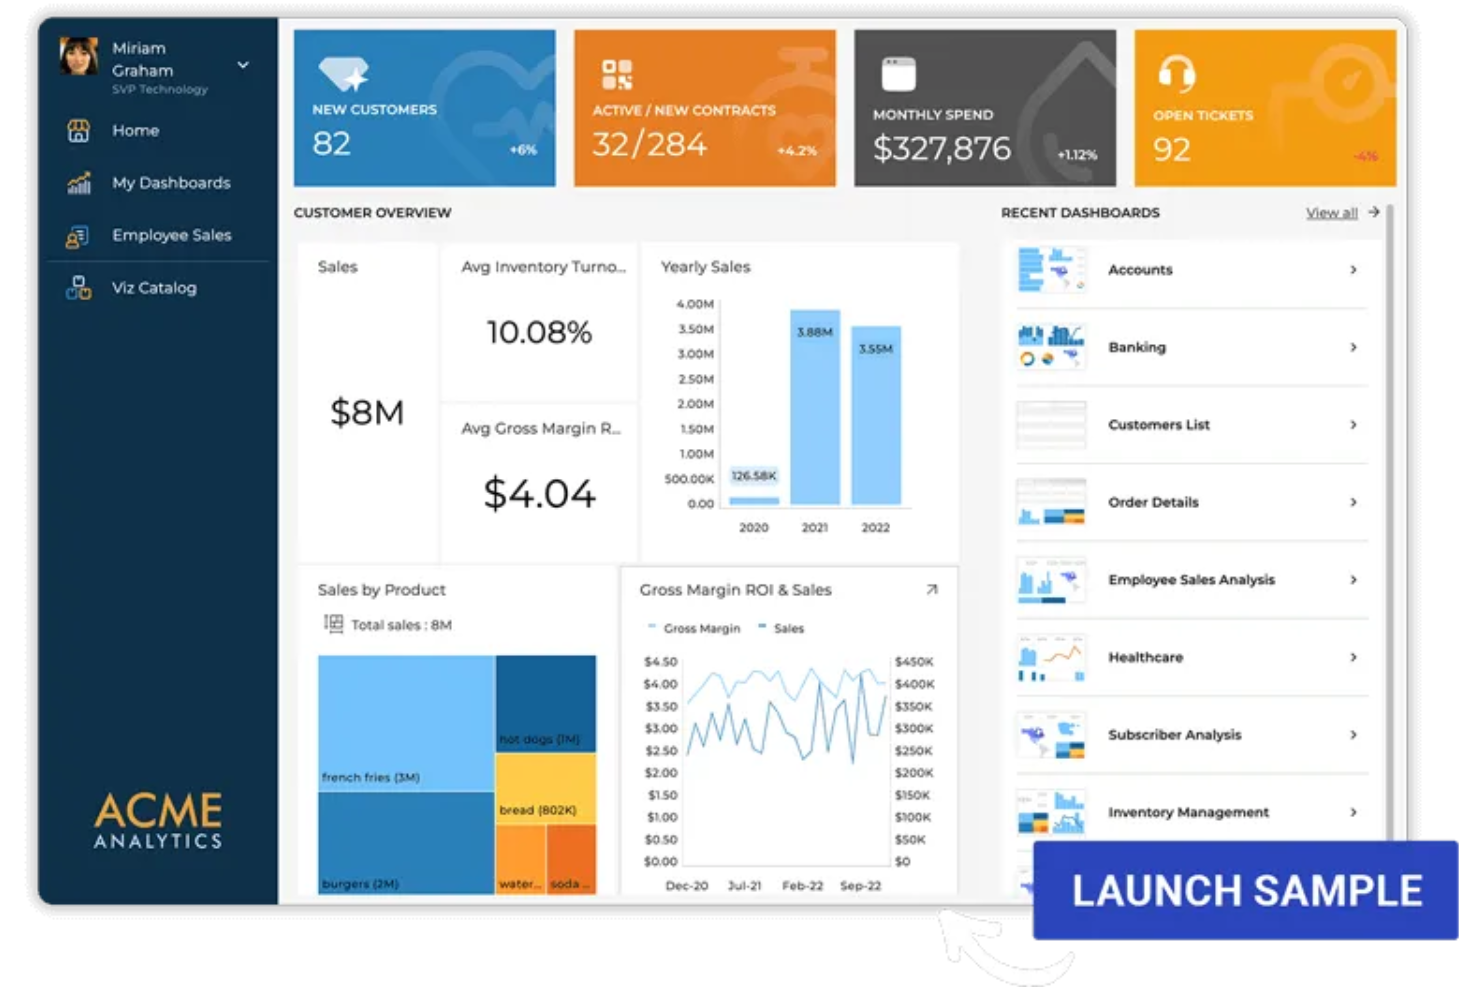
Reveal è pensato per i team di prodotto e le aziende software che desiderano integrare l'analisi direttamente nelle proprie applicazioni. Se devi offrire dashboard interattive e visualizzazioni dei dati all'interno del tuo prodotto, Reveal mette a disposizione SDK flessibili e opzioni di personalizzazione del marchio che Looker non offre. Questo approccio ti aiuta a fornire agli utenti finali insight in tempo reale senza indirizzarli verso una piattaforma di analisi separata.
Perché Reveal è una buona alternativa a Looker
A differenza di Looker, Reveal è progettato specificamente per integrare l'analisi direttamente nei tuoi prodotti software. Ho scelto Reveal perché i suoi SDK ti consentono di aggiungere dashboard interattive, grafici e visualizzazioni dei dati direttamente nella tua applicazione, così gli utenti non devono mai abbandonare la tua piattaforma per accedere agli insight. Reveal supporta anche la personalizzazione del marchio, il che significa che puoi applicare completamente il tuo brand all'esperienza di analisi. Per i team che si concentrano sull'offerta di analisi all'interno dell'applicazione, Reveal offre un livello di flessibilità e controllo che Looker non eguaglia.
Funzionalità principali di Reveal
Alcune altre funzionalità che rendono Reveal interessante includono:
- Connettività delle origini dati: Connettiti a un'ampia gamma di database, servizi cloud e fogli di calcolo.
- Controllo degli accessi basato sui ruoli: Imposta le autorizzazioni degli utenti per gestire chi può visualizzare o modificare i contenuti di analisi.
- Report pianificati: Automatizza la distribuzione dei report agli utenti secondo una pianificazione ricorrente.
- Dashboard ottimizzate per dispositivi mobili: Accedi alle dashboard di analisi e interagisci con esse da qualsiasi dispositivo mobile.
Integrazioni di Reveal
Le integrazioni includono PostgreSQL, MySQL, BigQuery, Snowflake, Databricks, Google Sheets, REST, JSON, Excel e altre origini dati supportate tramite i connettori SDK di Reveal.
Pros and Cons
Pros:
- Gli SDK di analisi integrabili supportano l'integrazione in applicazioni personalizzate
- Le opzioni di personalizzazione del marchio consentono di applicare completamente il proprio brand alle esperienze di analisi
- Le dashboard ottimizzate per dispositivi mobili offrono analisi reattive su qualsiasi dispositivo
Cons:
- Meno funzionalità avanzate di modellazione dei dati rispetto a Looker
- Documentazione limitata per scenari di integrazione complessi

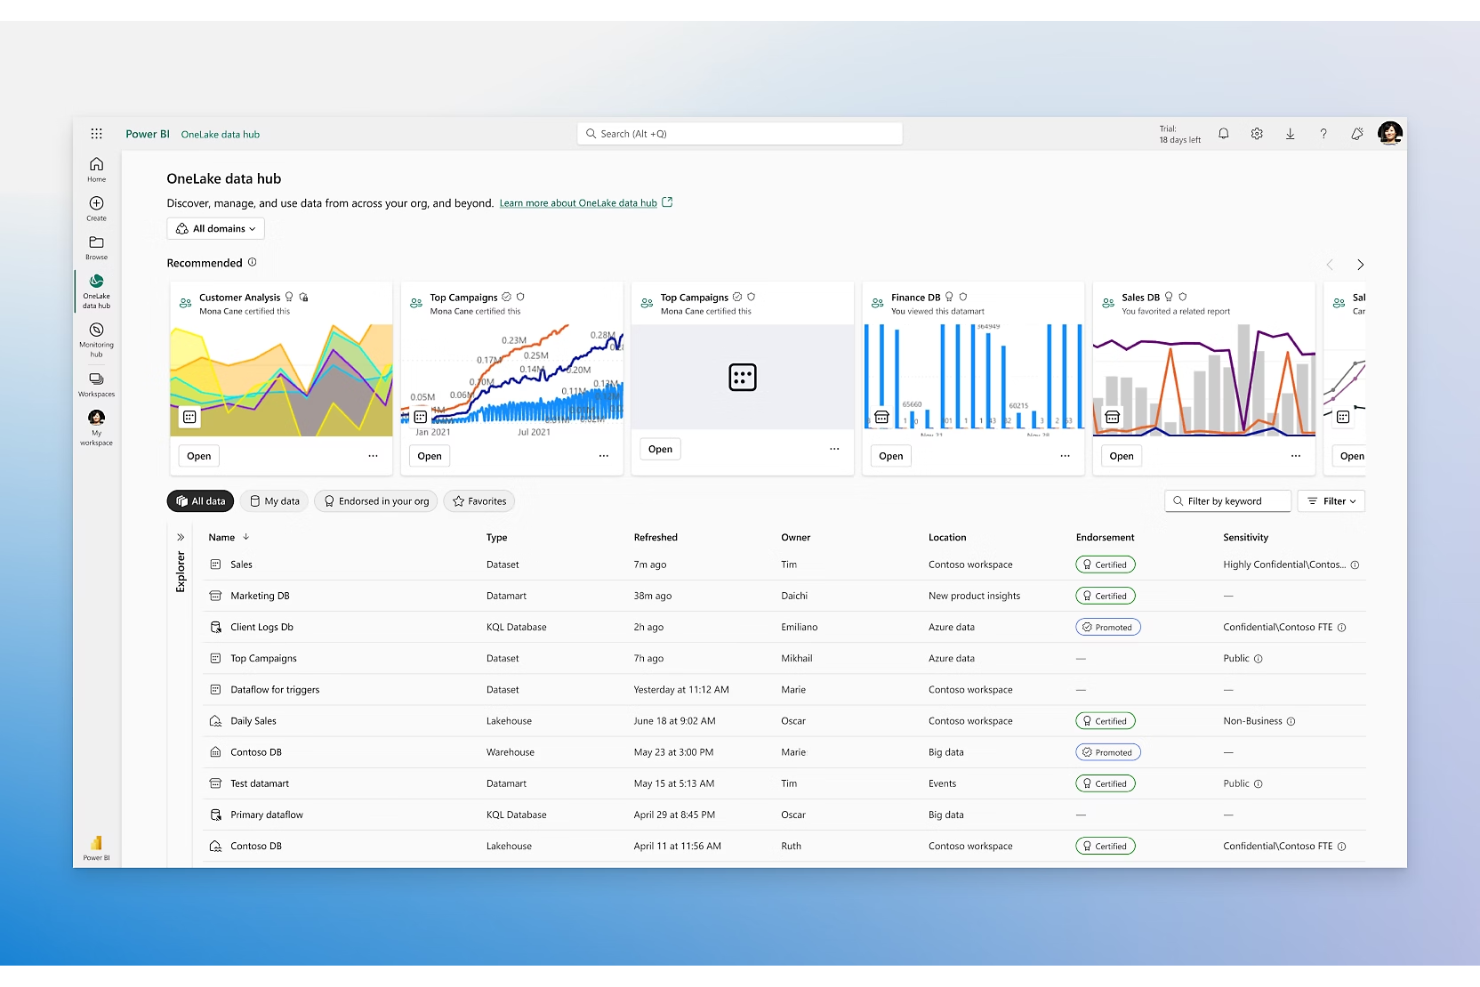
Se la tua azienda si affida già a Microsoft 365, Power BI offre un'estensione naturale per l'analisi e la reportistica. È particolarmente utile per i team del commercio al dettaglio e dell'e-commerce che desiderano collegare i dati di Excel, Teams e SharePoint per creare dashboard unificate. Power BI si distingue da Looker offrendo una profonda integrazione con gli strumenti di produttività Microsoft e interfacce familiari per gli utenti di tutta l'organizzazione.
Perché Microsoft Power BI è una buona alternativa a Looker
Per i team che hanno già investito in Microsoft 365, Power BI offre funzionalità di analisi che si integrano perfettamente nei flussi di lavoro esistenti. Ho scelto Power BI perché consente di acquisire dati direttamente da Excel, Teams e SharePoint, rendendo facile creare dashboard con gli strumenti che la tua azienda utilizza già. La sua integrazione con Microsoft 365 significa inoltre che puoi collaborare sui report e condividere informazioni dettagliate all'interno di app familiari. Se desideri funzionalità di analisi che sembrino una parte naturale del tuo ambiente Microsoft, Power BI offre un'esperienza diversa dalla piattaforma autonoma di Looker.
Funzionalità principali di Microsoft Power BI
Alcune altre funzionalità di Power BI che potrebbero essere utili per il tuo team includono:
- Informazioni dettagliate sui dati basate sull'intelligenza artificiale: Utilizza l'intelligenza artificiale integrata per rilevare schemi e generare informazioni dettagliate dai tuoi dati.
- Marketplace di elementi visivi personalizzati: Accedi a una raccolta di elementi visivi personalizzati creati da Microsoft e dalla community di Power BI per migliorare i tuoi report.
- Supporto per il gateway dati: Collega in modo sicuro le origini dati locali alle dashboard di Power BI utilizzando il gateway dati di Microsoft.
- Report impaginati: Crea report perfettamente fedeli ai pixel e pronti per la stampa, per esigenze operative e normative.
Integrazioni di Microsoft Power BI
Le integrazioni includono Microsoft Excel, Microsoft Teams, SharePoint, PowerPoint, Outlook, Microsoft Azure, Dynamics 365, OneDrive, Microsoft Dataverse e Microsoft Purview.
Pros and Cons
Pros:
- Elevata compatibilità con i flussi di lavoro di Microsoft 365
- Le query in linguaggio naturale semplificano l'esplorazione dei dati
- Ampia raccolta di elementi visivi personalizzati per le dashboard
Cons:
- Struttura delle licenze complessa per le funzionalità avanzate
- È necessaria la configurazione del gateway per accedere ai dati locali

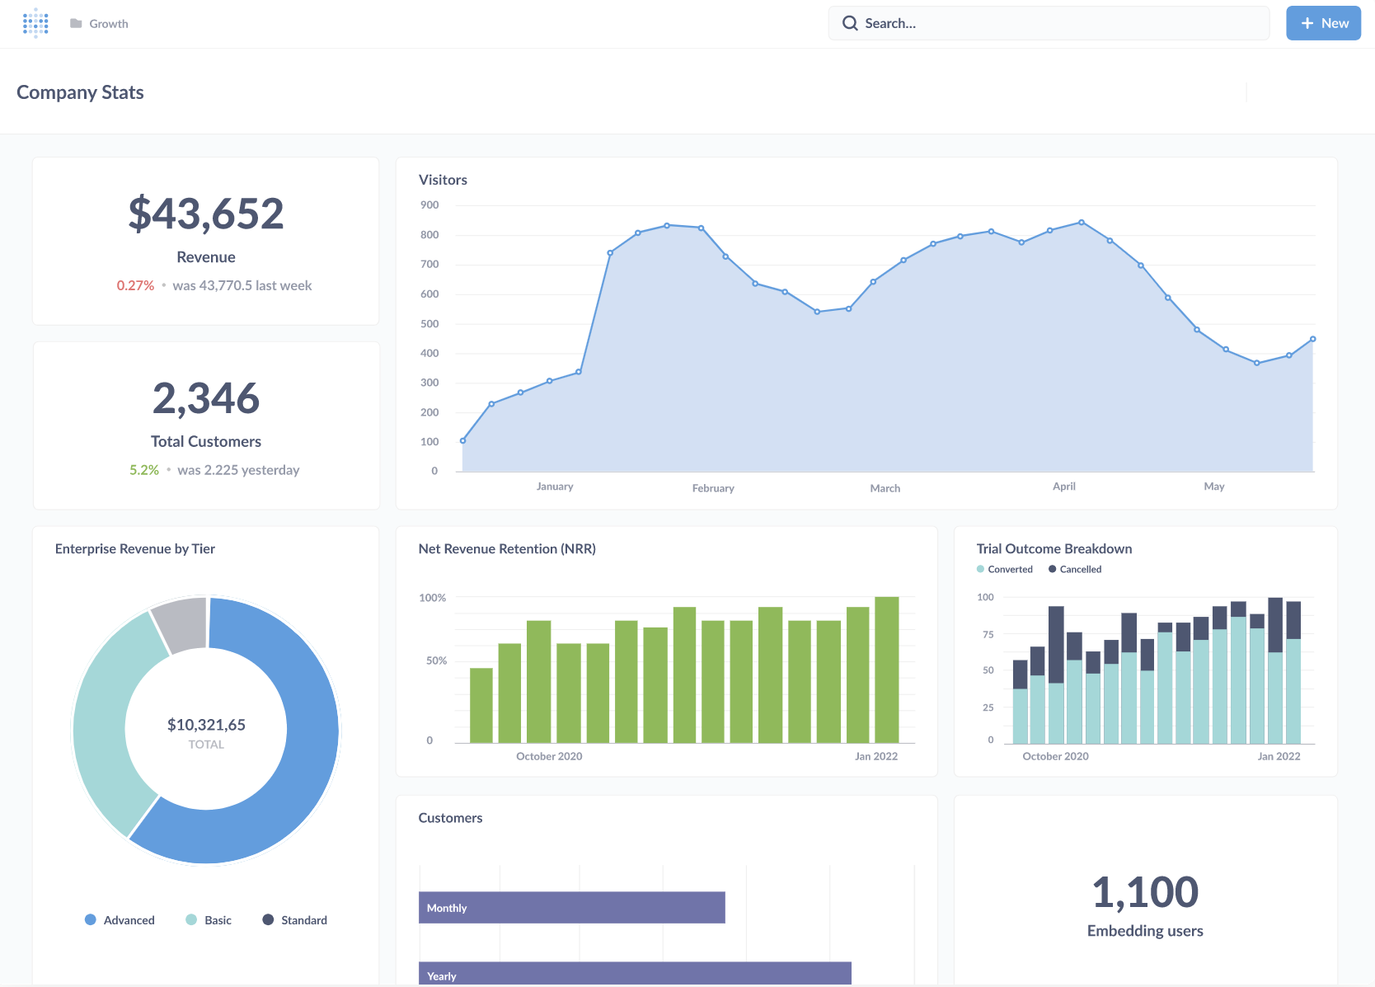
Per i team che desiderano il pieno controllo del proprio ambiente di analisi, Metabase offre una piattaforma open source progettata per la personalizzazione. È particolarmente adatta alle aziende del settore della vendita al dettaglio e dell'e-commerce con competenze tecniche interne, che desiderano adattare cruscotti, interrogazioni e flussi di lavoro alle proprie esigenze specifiche. A differenza di Looker, Metabase offre accesso diretto al codice sorgente, permettendo di adattare la piattaforma con l'evolversi della strategia relativa ai dati.
Perché Metabase è una buona alternativa a Looker
Se il tuo team desidera personalizzare ogni aspetto del proprio stack di analisi, Metabase si distingue per la sua flessibilità open source. Ho scelto Metabase perché consente di modificare il codice sorgente, creare visualizzazioni personalizzate e persino sviluppare le proprie estensioni per soddisfare esigenze aziendali specifiche. La piattaforma supporta interrogazioni SQL avanzate e permette di incorporare le analisi direttamente nelle proprie applicazioni. Per le organizzazioni che desiderano possedere e adattare il proprio ambiente di BI, Metabase offre un livello di controllo che Looker non è in grado di eguagliare.
Funzionalità principali di Metabase
Tra le altre funzionalità che rendono Metabase interessante figurano:
- Generatore di interrogazioni senza codice: crea interrogazioni complesse utilizzando un'interfaccia visiva senza scrivere SQL.
- Pianificazione automatica dei rapporti: pianifica l'invio ricorrente dei rapporti tramite e-mail o Slack.
- Cruscotti interattivi: crea cruscotti con filtri, analisi dettagliate e visualizzazioni dinamiche.
- Registri di controllo: monitora l'attività degli utenti e le modifiche all'interno della piattaforma per garantire conformità e sicurezza.
Integrazioni di Metabase
Le integrazioni includono Exasol, Cube, Databricks, Dremio, Druid, DuckDB, Firebolt, Google Sheets, Hydra, MariaDB, Snowflake e altro ancora.
Pros and Cons
Pros:
- La base di codice open source consente una personalizzazione completa e opzioni di hosting autonomo
- Supporta interrogazioni SQL dirette per esigenze avanzate di esplorazione dei dati
- Le analisi incorporabili consentono di aggiungere cruscotti alle proprie applicazioni
Cons:
- Supporto integrato limitato per la sicurezza a livello di riga e le autorizzazioni granulari
- Meno tipologie di visualizzazione avanzate rispetto ad alcuni concorrenti

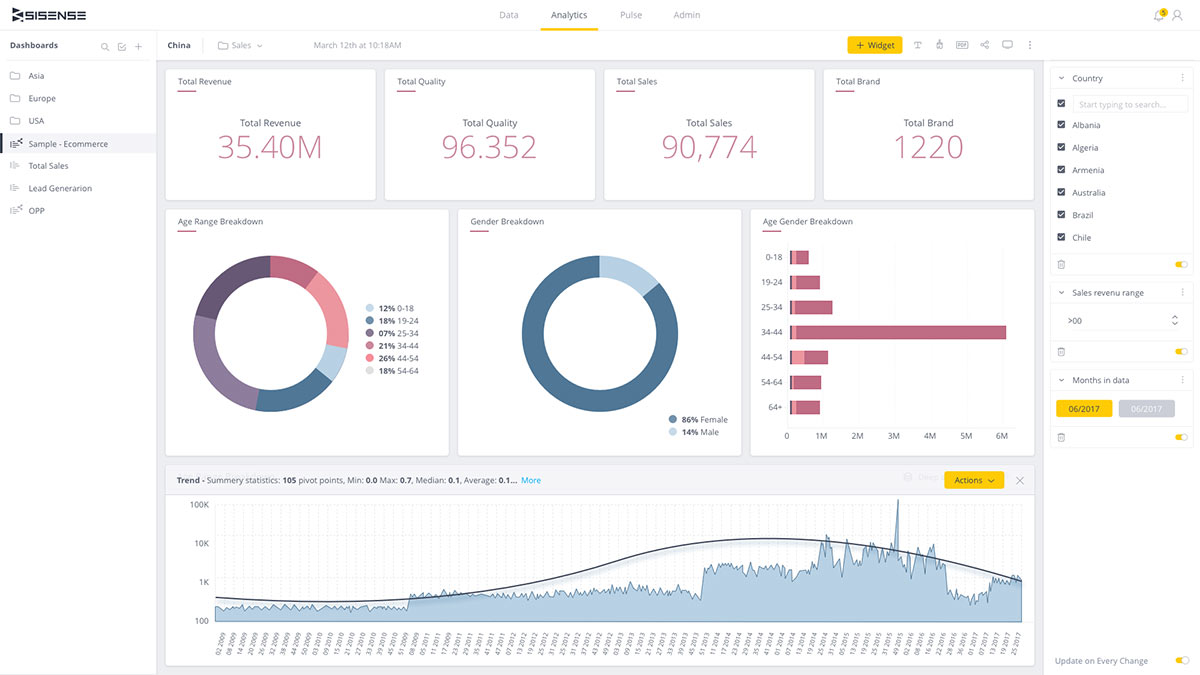
Se devi integrare l'analisi direttamente nei tuoi prodotti o nelle applicazioni rivolte ai clienti, Sisense è progettato proprio per questo scopo. Questa piattaforma è particolarmente adatta alle aziende software, ai fornitori SaaS e ai team digitali che desiderano offrire dashboard interattive e analisi all'interno delle proprie esperienze utente. Sisense si distingue da Looker offrendo API flessibili e opzioni di personalizzazione del marchio che ti consentono di controllare completamente l'aspetto e il funzionamento dell'analisi all'interno delle tue applicazioni.
Perché Sisense è una buona alternativa a Looker
Per i team che desiderano integrare l'analisi direttamente nei propri prodotti, Sisense offre un livello di flessibilità che Looker non raggiunge. Ho scelto Sisense perché la sua architettura basata sulle API e le opzioni di personalizzazione del marchio consentono di personalizzare completamente l'esperienza analitica per i tuoi utenti. Puoi controllare ogni aspetto, dal layout della dashboard al branding, e persino integrare l'analisi in flussi di lavoro complessi all'interno della tua app. Se devi offrire l'analisi come parte della tua proposta di prodotto, Sisense ti fornisce gli strumenti per farla percepire come una componente nativa della tua piattaforma.
Caratteristiche principali di Sisense
Alcune altre caratteristiche che mi hanno colpito includono:
- Modellazione dei dati Elasticube: Crea e gestisci modelli di dati personalizzati utilizzando il motore in memoria di Sisense.
- Query in linguaggio naturale: Consenti agli utenti di porre domande in linguaggio naturale e ottenere visualizzazioni istantanee.
- Report programmati: Automatizza la distribuzione di dashboard e report agli stakeholder secondo una pianificazione prestabilita.
- Controllo degli accessi basato sui ruoli: Imposta autorizzazioni granulari per utenti e gruppi per gestire la sicurezza dei dati.
Integrazioni di Sisense
Le integrazioni includono Snowflake, Google BigQuery, Amazon Redshift, Databricks, Azure Synapse, Salesforce, Oracle, PostgreSQL, MySQL e SQL Server.
Pros and Cons
Pros:
- L'integrazione dell'analisi nelle app web e mobili è altamente personalizzabile
- Le opzioni di personalizzazione del marchio consentono il controllo completo del branding delle dashboard
- Il motore Elasticube supporta la modellazione di dati complessi e query rapide
Cons:
- Gli strumenti di preparazione dei dati sono meno intuitivi rispetto ad alcuni concorrenti
- Le prestazioni delle dashboard possono rallentare con set di dati molto grandi

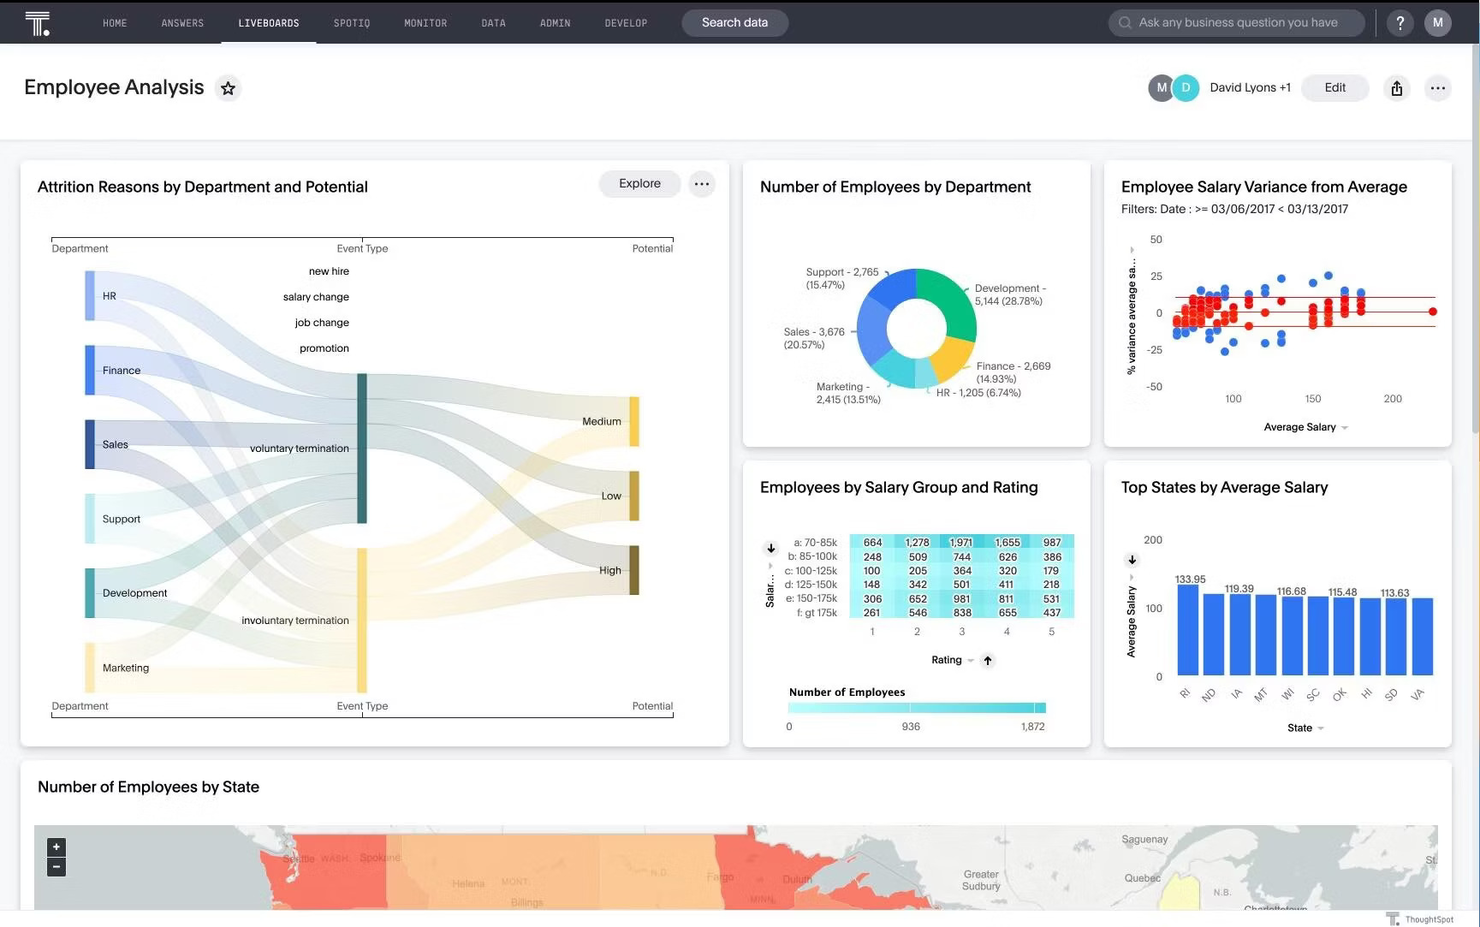
Se il tuo team vuole rendere l'esplorazione dei dati semplice quanto una ricerca online, ThoughtSpot è la soluzione che fa per voi. Questa piattaforma è particolarmente utile per i team del settore retail, dell'e-commerce e delle operazioni che hanno bisogno di risposte rapide e autonome da dati complessi senza dipendere dagli analisti. ThoughtSpot si distingue da Looker perché consente agli utenti di digitare interrogazioni in linguaggio naturale e generare istantaneamente rapporti e visualizzazioni interattivi.
Perché ThoughtSpot è una buona alternativa a Looker
A differenza degli strumenti di BI tradizionali, che richiedono la creazione anticipata di cruscotti, ThoughtSpot consente agli utenti di cercare informazioni utili utilizzando interrogazioni in linguaggio naturale. Ho scelto ThoughtSpot perché il suo motore di analisi basato sulla ricerca permette a chiunque di digitare una domanda e visualizzare istantaneamente grafici, tabelle o tendenze pertinenti. I suggerimenti basati sull'IA della piattaforma aiutano gli utenti a individuare i dati giusti, anche quando non sanno da dove iniziare. Per i team che desiderano risposte rapide e flessibili senza dover attendere il supporto di un analista, ThoughtSpot offre un approccio unico che lo distingue da Looker.
Caratteristiche principali di ThoughtSpot
Alcune delle altre funzionalità che hanno attirato la mia attenzione includono:
- Analisi in tempo reale sui dati nel cloud: Interroga i dati direttamente dai magazzini di dati nel cloud senza spostarli o duplicarli.
- Cruscotti: Crea e condividi cruscotti interattivi che si aggiornano in tempo reale.
- Livello di modellazione dei dati: Definisci relazioni, gerarchie e metriche personalizzate all'interno dei tuoi insiemi di dati.
- Controlli granulari degli accessi: Imposta autorizzazioni dettagliate per utenti, gruppi e origini dati.
Integrazioni di ThoughtSpot
Le integrazioni includono Snowflake, Google BigQuery, Amazon Redshift, Databricks, Microsoft Azure Synapse, Google Sheets, Salesforce, ServiceNow, Oracle e SAP.
Pros and Cons
Pros:
- La ricerca in linguaggio naturale consente un'esplorazione dei dati rapida e autonoma
- La capacità di eseguire interrogazioni in tempo reale si connette direttamente ai magazzini di dati nel cloud
- Le analisi basate sull'IA rilevano automaticamente tendenze e anomalie
Cons:
- Le opzioni di modellazione dei dati sono meno flessibili rispetto a LookML di Looker
- Le possibilità di personalizzazione delle visualizzazioni sono limitate rispetto ad alcuni concorrenti

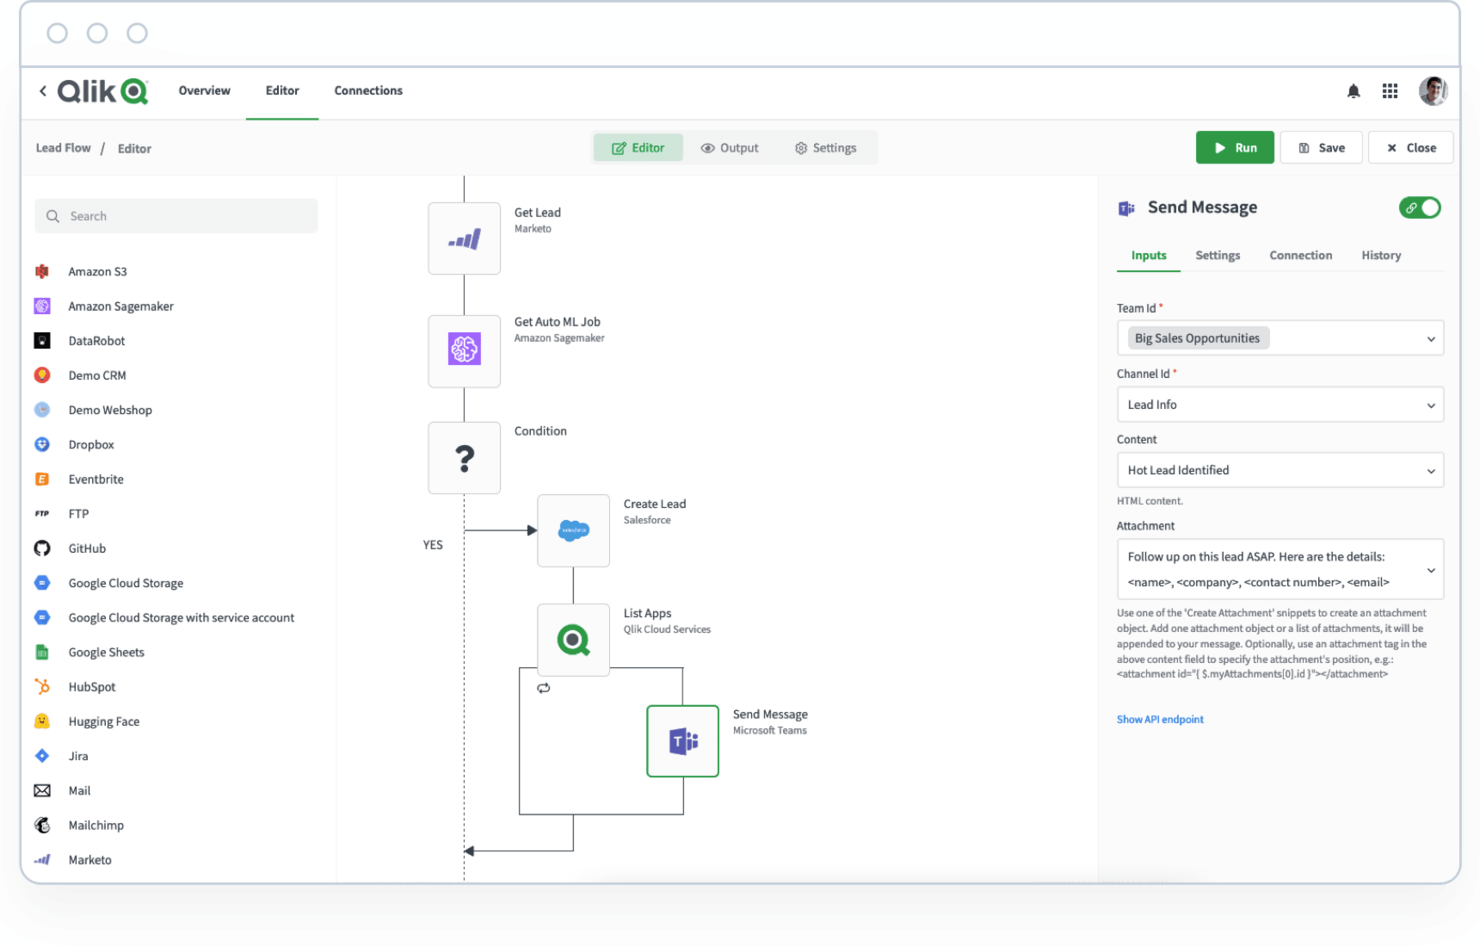
A differenza della maggior parte delle piattaforme di analisi, Qlik Sense utilizza un motore di dati associativo che consente di esplorare i dati da qualsiasi prospettiva senza percorsi di query predefiniti. Questo approccio è particolarmente utile per i team del commercio al dettaglio e dell'e-commerce che devono scoprire relazioni nascoste tra dati relativi a vendite, inventario e clienti. Qlik Sense si distingue da Looker perché consente agli utenti di navigare liberamente e scoprire informazioni che potrebbero sfuggire con gli strumenti tradizionali basati su SQL.
Perché Qlik Sense è una buona alternativa a Looker
Qlik Sense adotta un approccio diverso da Looker utilizzando un motore di dati associativo che consente di esplorare i dati senza essere limitati a query predefinite. Ho scelto Qlik Sense per la sua capacità di far emergere connessioni inaspettate tra i punti dati, una caratteristica particolarmente utile per i team del commercio al dettaglio e dell'e-commerce che lavorano con set di dati complessi e provenienti da più fonti. Il suo modello di selezione interattiva consente di fare clic su qualsiasi valore e vedere immediatamente come si relaziona al resto dei dati, facilitando l'individuazione di tendenze e valori anomali. Se desideri una piattaforma che incoraggi l'esplorazione e la scoperta senza vincoli, Qlik Sense offre un'alternativa unica all'analisi più strutturata e basata su SQL di Looker.
Funzionalità principali di Qlik Sense
Oltre all'esplorazione associativa dei dati, ho individuato anche queste funzionalità degne di nota:
- Analisi aumentata: sfrutta suggerimenti e informazioni basati sull'intelligenza artificiale per guidare l'analisi e mettere in evidenza le tendenze principali.
- Preparazione autonoma dei dati: prepara, combina e trasforma dati provenienti da più fonti senza dipendere dal reparto IT.
- Design responsivo: crea dashboard che si adattano automaticamente a qualsiasi dispositivo, inclusi computer desktop, tablet e smartphone.
- Analisi integrate: integra visualizzazioni e dashboard di Qlik Sense direttamente nelle tue applicazioni o nei tuoi siti web.
Integrazioni di Qlik
Le integrazioni includono AWS, Google Cloud, Microsoft Azure, Snowflake, SAP, Databricks, Cloudera, Salesforce, Oracle e Teradata.
Pros and Cons
Pros:
- Il motore associativo abilita percorsi di esplorazione dei dati flessibili e non lineari
- L'elaborazione in memoria consente un'analisi rapida di grandi set di dati
- L'analisi aumentata integrata fa emergere informazioni utili con suggerimenti basati sull'intelligenza artificiale
Cons:
- Le funzionalità di governance dei dati sono meno granulari rispetto al modello di Looker
- Per le trasformazioni avanzate dei dati è spesso necessario ricorrere a script complessi
Altre alternative a Looker
Ecco alcune alternative aggiuntive a Looker che non sono state incluse nella mia selezione, ma che vale comunque la pena prendere in considerazione:
- Apache Superset
Ideale per implementazioni autogestite
- Zoho Analytics
Ideale per la reportistica unificata delle app aziendali
- Toucan
Ideale per l'analisi guidata per i team aziendali


Come Valuto le Alternative a Looker
Valuto gli strumenti su due livelli: requisiti di base—come la connettività POS e dashboard self-service—e fattori differenzianti che distinguono le vere piattaforme pronte per il retail dai semplici strumenti BI generici.
Funzionalità di Base (Requisiti Indispensabili per Questa Lista)
Quando seleziono gli strumenti per la mia lista, valuto ciascuno su una scala da 0 (funzionalità assente) a 5 (eccellenza in quest'area) per ogni funzionalità di base elencata di seguito. Successivamente, calcolo il punteggio totale dello strumento in percentuale. Ogni strumento deve raggiungere un punteggio minimo totale del 65% per essere preso in considerazione.
- Connettività a Dati Multi-Sorgente: Verifico se uno strumento si connette nativamente a POS, ERP e piattaforme ecommerce—non solo a data warehouse in cloud—così che i team retail possano unificare dati su vendite e inventario.
- Modellazione Semantica dei Dati: Qui conta un layer di metriche governato. Cerco definizioni riutilizzabili di KPI come margine, sell-through, e vendite same-store che restino coerenti in tutte le dashboard.
- Dashboard Interattivi & Visualizzazione: Valuto drill-down dalle performance regionali fino al dettaglio del singolo negozio o SKU, insieme a cross-filtering e tipi di grafici rilevanti per il retail.
- Esplorazione Self-Service: Store manager e merchandiser devono poter analizzare i dati in autonomia. Cerco query builder drag-and-drop o esplorazione guidata che non richiedano conoscenze SQL.
- Report Pianificati & Avvisi: Valuto se lo strumento può automatizzare riepiloghi giornalieri sulle vendite e innescare avvisi basati su soglie—come segnalare quando l'inventario di una sede scende sotto i livelli di riordino.
- Analytics Integrati & Mobile: Team sul campo e in negozio necessitano di accedere alle dashboard ovunque. Cerco app mobile o visualizzazioni responsive e opzioni di embedding per portali interni.
Una volta stilata la lista degli strumenti che rispettano questi criteri, considero cosa distingue ciascuna piattaforma.
Fattori Differenzianti (Cosa Distingue i Fornitori)
Ecco come confronto e metto in contrasto i vari fornitori:
Caratteristiche Distintive
I template preconfigurati per il retail sono un importante fattore di differenziazione. Cerco dashboard già pronte per monitorare basket size, differenze inventariali e mix di categoria dal primo giorno, risparmiando settimane di configurazione. Anche la query in linguaggio naturale è una funzionalità che valuto, specialmente per store manager che necessitano di risposte rapide sulle vendite giornaliere senza dover inviare richieste al team BI. L'analisi geospaziale conta molto per i retailer multi-sede, dove visualizzazioni su mappa delle performance dei negozi e sovrapposizione delle aree di influenza aiutano le operation a prendere decisioni più intelligenti sulle espansioni.
Oltre le Caratteristiche
Il costo totale di proprietà è uno degli aspetti principali che valuto. La licenza Looker per utente può diventare costosa quando si devono distribuire dashboard a centinaia di dipendenti nei negozi. Analizzo anche le integrazioni con lo stack tecnologico retail—il fatto che uno strumento si connetta nativamente a POS, ERP e piattaforme ecommerce incide su quanto lavoro di data engineering separa l'utente dalle analisi utilizzabili. Conta molto anche la scalabilità, specialmente per i retailer con dati SKU ad alta cardinalità e utenti concorrenti in decine o centinaia di punti vendita.
Perché cercare un'alternativa a Looker?
Sebbene Looker sia un valido strumento di business intelligence, ci sono diversi motivi per cui gli acquirenti iniziano a confrontare le migliori alternative. Potresti cercare un'alternativa a Looker perché…
- Vuoi una curva di apprendimento più breve per gli utenti aziendali e i team non tecnici
- Hai bisogno di un'interfaccia più intuitiva basata sul trascinamento e rilascio per creare dashboard
- Vuoi strumenti di visualizzazione più facili da usare per creare report più rapidamente
- Il tuo team ha bisogno di funzionalità avanzate senza dipendere così tanto dalla configurazione tecnica
- Vuoi un supporto più completo per le previsioni o un accesso più semplice alle funzionalità analitiche avanzate
- Hai bisogno di connessioni a strumenti come Google Analytics nell'ambito del tuo flusso di lavoro per la reportistica
- Vuoi prezzi o pacchetti più adatti ai team in crescita o a un numero illimitato di utenti
Se ti riconosci in una di queste situazioni, sei nel posto giusto. Questo elenco include alcune delle migliori alternative a Looker per i team che necessitano di funzionalità analitiche flessibili, flussi di lavoro per la reportistica più semplici o una soluzione più adatta alle esigenze della propria attività.
Funzionalità principali di Looker
Ecco alcune delle funzionalità principali di Looker, per aiutarti a confrontare ciò che offrono le soluzioni alternative:
- Modellazione centralizzata dei dati con il linguaggio LookML
- Dashboard personalizzabili e visualizzazioni interattive
- Distribuzione programmata e automatizzata dei report
- Analisi integrate per applicazioni esterne
- Sicurezza a livello di riga e autorizzazioni granulari per gli utenti
- Integrazione con Google Cloud e BigQuery
- Esplorazione dei dati in tempo reale e interrogazioni ad hoc
- Accesso tramite API per flussi di lavoro e integrazioni personalizzati
- Controllo delle versioni per modelli analitici e dashboard