

Tableau-recension: Fördelar, nackdelar, funktioner och priser
Tableau utmärker sig inom detaljhandelsanalys genom att erbjuda intuitiv datavisualisering som hjälper ditt team att fatta välgrundade beslut snabbt.

We review tools independently, and commissions help fund our testing. See our transparency policy, our methodology, or suggest a tool.
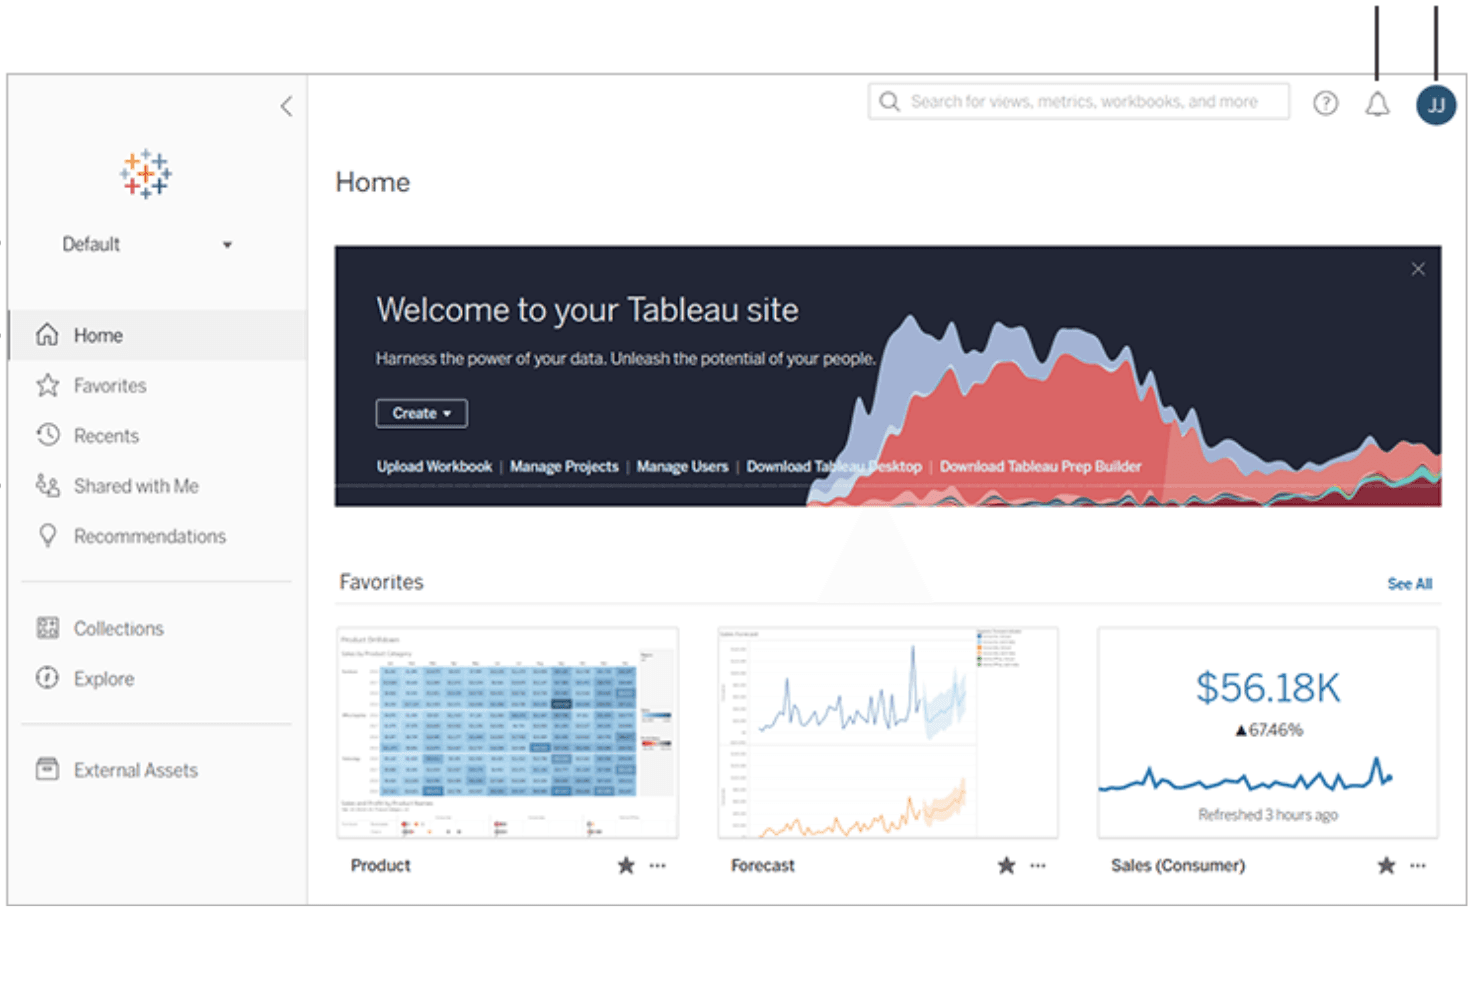
Tableau is a retail analytics software built around visual data exploration—letting retail teams analyze sales trends, monitor inventory, and surface channel performance through highly customizable dashboards. It's worth considering when your team needs more control over how data is visualized and explored than Microsoft Power BI typically allows, particularly if you're connecting multiple data sources and need reporting that can flex to match how your business actually operates.
Tableau Evaluation Summary
4.5/5
- Pricing upon request
- 14-day free trial
Why Trust Our Software Recommendations
6,700+
Reviews
20
Industry experts
16+
Evaluation factors
14
Years
Our team has been testing and reviewing software since 2012. As retail leaders ourselves, we know how difficult—and important—it is to choose the right software.
For this guide, we evaluated tools using hands-on testing and independent research, scoring tools using our selection criteria.
Our reviews reflect our independent judgment—not a sales pitch.
Tableau Overview
In my opinion, Tableau is a strong choice for retail analytics, especially for teams needing powerful data visualization. Its intuitive interface and robust onboarding make it accessible, but its value may vary depending on your budget. Compared to competitors, Tableau excels in visualizing complex data but might not offer the best integration options for reducing tool usage. It's best suited for mid-sized to large retail operations that prioritize insightful visual reports over minimizing tool count. If your team values detailed data representation and can handle the occasional integration hiccup, Tableau is worth considering.
Pros
- Your team can create detailed visual reports with ease.
- It offers a user-friendly interface that simplifies data analysis.
- Onboarding is smooth, helping your team get up to speed quickly.
Cons
- Your team might find some advanced features require a learning curve.
- It can be resource-intensive, potentially slowing down older systems.
- Customer support response times may not always meet your expectations.
Is Tableau Right For Your Needs?
Who Would be a Good Fit for Tableau?
Tableau is ideal for retail managers, data analysts, and marketing teams who need to visualize data and gain insights quickly. If your work involves handling large datasets, Tableau's powerful visualization capabilities can simplify complex data into understandable visuals. Teams in industries like fashion and electronics, where detailed sales and customer analytics are crucial, will find Tableau's user-friendly interface and visual reporting beneficial. It's especially valuable for organizations that prioritize data-driven decisions and need to present complex insights clearly
- Fashion RetailYour team can benefit from Tableau's visual reports to track and analyze seasonal sales trends effectively.
- Electronics CompaniesTableau helps your team understand customer behavior and product performance with its detailed analytics.
- Data AnalystsIf your work involves large datasets, Tableau's visualization tools make complex data easy to interpret.
- Marketing TeamsYour team can use Tableau to create impactful visual reports that drive strategic marketing decisions.
- Mid-Sized BusinessesTableau's functionalities fit well with your need for comprehensive data analysis without overwhelming resources.
- Sales DepartmentsYour team can leverage Tableau's insights to optimize sales strategies and improve performance metrics.
Who Would be a Bad Fit for Tableau?
Tableau may not suit small businesses or startups with limited budgets and resources. If your team needs simple analytics without complex visualization, Tableau's advanced features might be overkill. Industries with minimal data analysis needs or those requiring seamless integration with various tools might find Tableau's setup cumbersome. Additionally, if your team lacks technical expertise, the learning curve for some features could be a barrier.
- Small BusinessesYour team might find Tableau's advanced features unnecessary and costly for basic analytics needs.
- StartupsIf your work involves limited data analysis, Tableau's capabilities may be more than you require.
- Non-Technical TeamsWithout technical expertise, your team might struggle with Tableau's more complex functionalities.
- Low Budget OperationsYour team might find Tableau's cost challenging if resources are tight.
- Simple Reporting NeedsIf your work only needs basic reports, Tableau's advanced visualization tools might be excessive.
- Tool-Heavy WorkflowsIf your team relies on multiple integrations, Tableau might not fit seamlessly into your current setup.
Our Review Methodology
How We Test & Score Tools
We’ve spent years building, refining, and improving our software testing and scoring system. The rubric is designed to capture the nuances of software selection and what makes a tool effective, focusing on critical aspects of the decision-making process.
Below, you can see exactly how our testing and scoring works across seven criteria. It allows us to provide an unbiased evaluation of the software based on core functionality, standout features, ease of use, onboarding, customer support, integrations, customer reviews, and value for money.
Core Functionality (25% of final scoring)
The starting point of our evaluation is always the core functionality of the tool. Does it have the basic features and functions that a user would expect to see? Are any of those core features locked to higher-tiered pricing plans? At its core, we expect a tool to stand up against the baseline capabilities of its competitors.
Standout Features (25% of final scoring)
Next, we evaluate uncommon standout features that go above and beyond the core functionality typically found in tools of its kind. A high score reflects specialized or unique features that make the product faster, more efficient, or offer additional value to the user.
We also evaluate how easy it is to integrate with other tools typically found in the tech stack to expand the functionality and utility of the software. Tools offering plentiful native integrations, 3rd party connections, and API access to build custom integrations score best.
Ease of Use (10% of final scoring)
We consider how quick and easy it is to execute the tasks defined in the core functionality using the tool. High scoring software is well designed, intuitive to use, offers mobile apps, provides templates, and makes relatively complex tasks seem simple.
Onboarding (10% of final scoring)
We know how important rapid team adoption is for a new platform, so we evaluate how easy it is to learn and use a tool with minimal training. We evaluate how quickly a team member can get set up and start using the tool with no experience. High scoring solutions indicate little or no support is required.
Customer Support (10% of final scoring)
We review how quick and easy it is to get unstuck and find help by phone, live chat, or knowledge base. Tools and companies that provide real-time support score best, while chatbots score worst.
Customer Reviews (10% of final scoring)
Beyond our own testing and evaluation, we consider the net promoter score from current and past customers. We review their likelihood, given the option, to choose the tool again for the core functionality. A high scoring software reflects a high net promoter score from current or past customers.
Value for Money (10% of final scoring)
Lastly, in consideration of all the other criteria, we review the average price of entry level plans against the core features and consider the value of the other evaluation criteria. Software that delivers more, for less, will score higher.
Core Features
Data Visualization
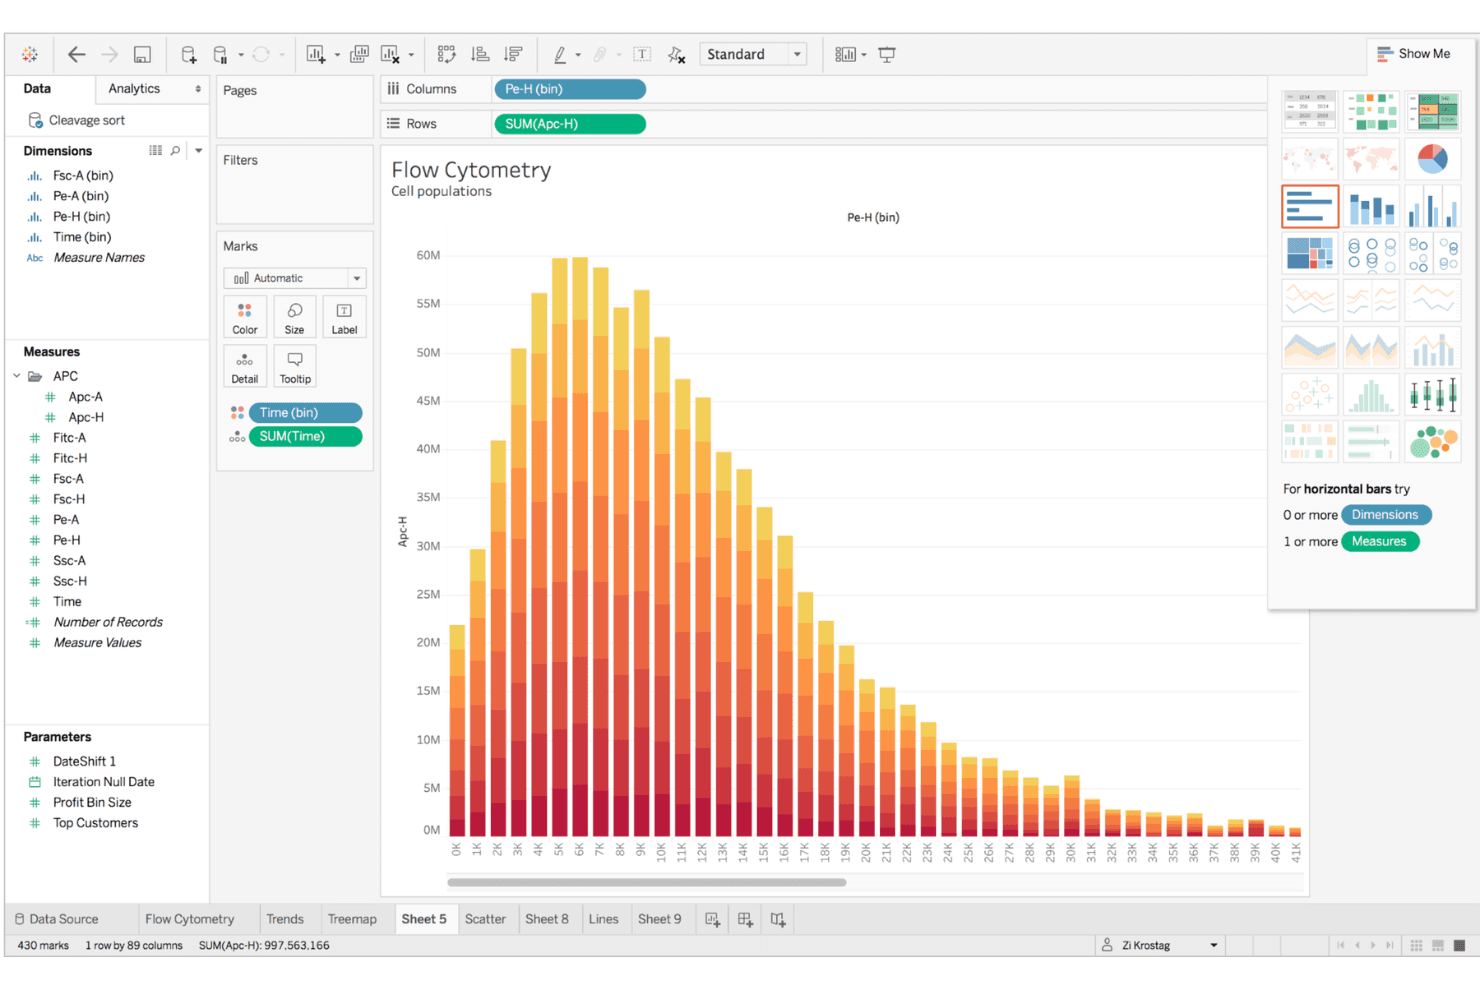
Tableau offers powerful tools for creating detailed visual reports, making complex data easy for your team to understand. You can drag and drop data to create graphs that highlight key insights.
Dashboard Creation
Build interactive dashboards that your team can customize to track KPIs, metrics, and trends. This feature allows you to see all your important metrics in one place.
Data Blending
Combine data from different sources to get a comprehensive view of your analytics. Your team can merge datasets and apply data modeling techniques to uncover deeper insights.
Real-Time Analytics
Tableau updates data in real-time, allowing your team to make informed decisions quickly. You won't miss out on current trends and metrics.
Collaboration Tools
Share insights and reports easily with your team to foster collaboration. Everyone stays on the same page with shared data visualizations.
Customizable Reports
Tailor reports to fit your team's specific needs and preferences. This flexibility helps you present data in a way that best serves your objectives.
Ease of Use
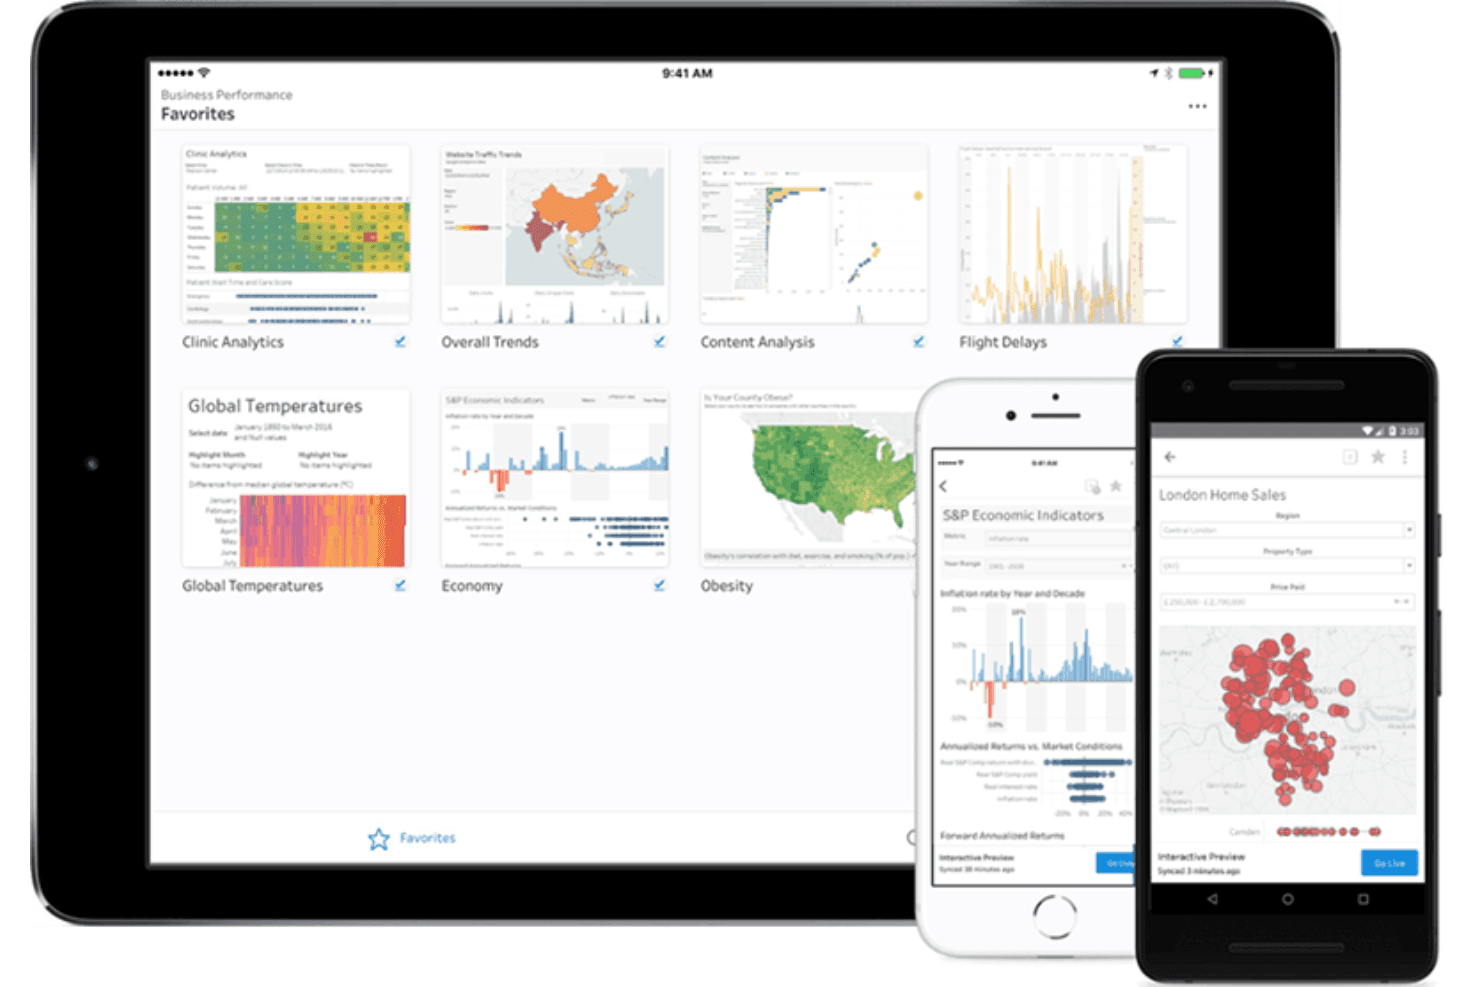
Tableau is generally user-friendly, with an intuitive interface that lets your team easily create visual reports and dashboards. Its drag-and-drop interface simplifies data visualization, making it accessible even for those with limited technical skills. However, some advanced features might have something of a steep learning curve, especially for non-technical users. Compared to other software, Tableau stands out for its ability to quickly turn data into actionable insights, which is valuable for your team's decision-making process.
Integrations
Tableau integrates with Azure Data Lake, Amazon S3, Google BigQuery, LinkedIn Sales Navigator, Salesforce CRM, Rollstack, dbt Semantic Layer, Ocient JDBC, MongoDB SQL, and Yellowbrick.
Tableau also offers an API for custom integrations and connects with third-party integration tools.
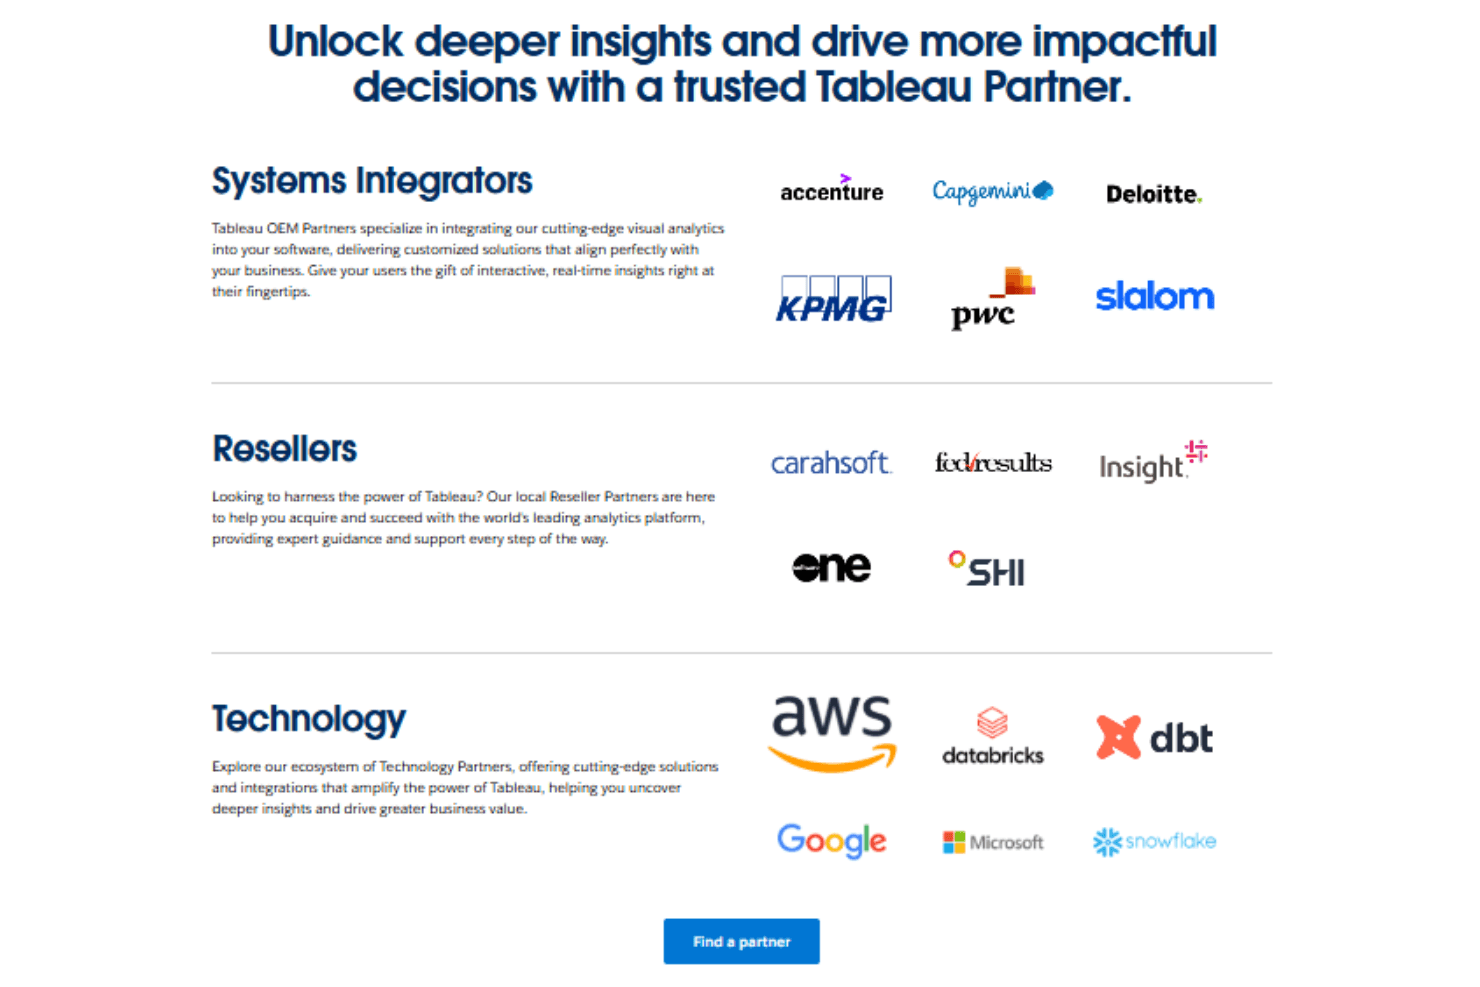
Tableau Specs
- A/B Testing: Yes
- Access Management: Yes
- Analytics: Yes
- API: Yes
- Conversion Tracking: Yes
- Custom Reports: Yes
- Customer Management: Yes
- Dashboards: Yes
- Data Export: Yes
- Data Import: Yes
- Data Mining: Yes
- Data Visualization: Yes
- External Integrations: Yes
- Forecasting: Yes
- Inventory Tracking: Yes
- Keyword Tracking: Yes
- Link Tracking: Yes
- Multi-User: Yes
- Notifications: Yes
- Project Management: Yes
- Reports: No
- Scenario Planning: Yes
- SEO: Yes
- Supplier Management: Yes
- Visualization: Yes


