

Recensione di Tableau: vantaggi, svantaggi, funzionalità e prezzi
Tableau eccelle nell'analisi del settore retail offrendo una visualizzazione intuitiva dei dati che consente al tuo team di prendere rapidamente decisioni informate.

Recensiamo gli strumenti in modo indipendente, e le commissioni aiutano a finanziare i nostri test. Consulta la nostra politica sulla trasparenza, la nostra metodologia o suggerisci uno strumento.
Tableau is a retail analytics software built around visual data exploration—letting retail teams analyze sales trends, monitor inventory, and surface channel performance through highly customizable dashboards. It's worth considering when your team needs more control over how data is visualized and explored than Microsoft Power BI typically allows, particularly if you're connecting multiple data sources and need reporting that can flex to match how your business actually operates.
Tableau Evaluation Summary
4.5/5
- Pricing upon request
- 14-day free trial
Perché fidarsi dei nostri consigli sui software
6,700+
Reviews
20
Industry experts
16+
Evaluation factors
14
Years
Il nostro team testa e recensisce software dal 2012. In quanto leader del retail noi stessi, sappiamo quanto sia difficile — e importante — scegliere il software giusto.
Per questa guida, abbiamo valutato gli strumenti attraverso test pratici e ricerche indipendenti, assegnando un punteggio agli strumenti in base ai nostri criteri di selezione.
Le nostre recensioni riflettono il nostro giudizio indipendente, non un discorso di vendita.
Tableau Overview
In my opinion, Tableau is a strong choice for retail analytics, especially for teams needing powerful data visualization. Its intuitive interface and robust onboarding make it accessible, but its value may vary depending on your budget. Compared to competitors, Tableau excels in visualizing complex data but might not offer the best integration options for reducing tool usage. It's best suited for mid-sized to large retail operations that prioritize insightful visual reports over minimizing tool count. If your team values detailed data representation and can handle the occasional integration hiccup, Tableau is worth considering.
Pros
- Your team can create detailed visual reports with ease.
- It offers a user-friendly interface that simplifies data analysis.
- Onboarding is smooth, helping your team get up to speed quickly.
Cons
- Your team might find some advanced features require a learning curve.
- It can be resource-intensive, potentially slowing down older systems.
- Customer support response times may not always meet your expectations.
Is Tableau Right For Your Needs?
Who Would be a Good Fit for Tableau?
Tableau is ideal for retail managers, data analysts, and marketing teams who need to visualize data and gain insights quickly. If your work involves handling large datasets, Tableau's powerful visualization capabilities can simplify complex data into understandable visuals. Teams in industries like fashion and electronics, where detailed sales and customer analytics are crucial, will find Tableau's user-friendly interface and visual reporting beneficial. It's especially valuable for organizations that prioritize data-driven decisions and need to present complex insights clearly
- Fashion RetailYour team can benefit from Tableau's visual reports to track and analyze seasonal sales trends effectively.
- Electronics CompaniesTableau helps your team understand customer behavior and product performance with its detailed analytics.
- Data AnalystsIf your work involves large datasets, Tableau's visualization tools make complex data easy to interpret.
- Marketing TeamsYour team can use Tableau to create impactful visual reports that drive strategic marketing decisions.
- Mid-Sized BusinessesTableau's functionalities fit well with your need for comprehensive data analysis without overwhelming resources.
- Sales DepartmentsYour team can leverage Tableau's insights to optimize sales strategies and improve performance metrics.
Who Would be a Bad Fit for Tableau?
Tableau may not suit small businesses or startups with limited budgets and resources. If your team needs simple analytics without complex visualization, Tableau's advanced features might be overkill. Industries with minimal data analysis needs or those requiring seamless integration with various tools might find Tableau's setup cumbersome. Additionally, if your team lacks technical expertise, the learning curve for some features could be a barrier.
- Small BusinessesYour team might find Tableau's advanced features unnecessary and costly for basic analytics needs.
- StartupsIf your work involves limited data analysis, Tableau's capabilities may be more than you require.
- Non-Technical TeamsWithout technical expertise, your team might struggle with Tableau's more complex functionalities.
- Low Budget OperationsYour team might find Tableau's cost challenging if resources are tight.
- Simple Reporting NeedsIf your work only needs basic reports, Tableau's advanced visualization tools might be excessive.
- Tool-Heavy WorkflowsIf your team relies on multiple integrations, Tableau might not fit seamlessly into your current setup.
La Nostra Metodologia di Recensione
Come Testiamo e Valutiamo gli Strumenti
Abbiamo trascorso anni a costruire, perfezionare e migliorare il nostro sistema di test e valutazione dei software. Il nostro schema di valutazione è progettato per cogliere le sfumature della selezione dei software e per comprendere cosa rende uno strumento efficace, concentrandosi su aspetti critici del processo decisionale. Qui sotto puoi vedere esattamente come funzionano i nostri test e valutazioni attraverso sette criteri. Questo ci permette di fornire una valutazione imparziale del software basata su funzionalità principali, caratteristiche distintive, facilità d’uso, onboarding, supporto clienti, integrazioni, recensioni dei clienti e rapporto qualità-prezzo.
Funzionalità di base (25% della valutazione finale)
Il punto di partenza della nostra valutazione è sempre la funzionalità principale dello strumento. Ha le funzioni e le caratteristiche di base che un utente si aspetterebbe? Alcune di queste funzionalità sono bloccate a piani tariffari di livello superiore? Alla base, ci aspettiamo che uno strumento regga il confronto con le capacità minime dei suoi concorrenti.
Caratteristiche distintive (25% della valutazione finale)
Successivamente valutiamo caratteristiche distintive e non comuni che vadano oltre la normale funzionalità presente in strumenti simili. Un punteggio alto riflette funzionalità specializzate o uniche che rendono il prodotto più veloce, efficiente o che offrano valore aggiunto all’utente. Valutiamo anche quanto sia facile integrare il software con altri strumenti della consueta infrastruttura tecnologica per espanderne la funzionalità e l’utilità. Gli strumenti che offrono molte integrazioni native, connessioni di terze parti e accesso API per costruire integrazioni personalizzate ottengono il punteggio più alto.
Facilità d’uso (10% della valutazione finale)
Consideriamo quanto sia rapido e semplice eseguire le attività definite nelle funzionalità di base utilizzando lo strumento. I software che ottengono un punteggio alto sono ben progettati, intuitivi, offrono app mobili, modelli pronti e rendono compiti complessi relativamente semplici.
Onboarding (10% della valutazione finale)
Sappiamo quanto sia importante una rapida adozione da parte del team per una nuova piattaforma, quindi valutiamo quanto sia facile imparare a usare uno strumento con una formazione minima. Esaminiamo quanto tempo impiega un membro del team a configurarsi e iniziare a utilizzare lo strumento senza esperienza. Le soluzioni con punteggi elevati richiedono poco o nessun supporto.
Supporto clienti (10% della valutazione finale)
Valutiamo quanto sia rapido e facile ricevere assistenza e trovare aiuto tramite telefono, live chat o base di conoscenza. Gli strumenti e le aziende che forniscono un supporto in tempo reale ottengono i punteggi migliori, mentre i chatbot hanno i punteggi più bassi.
Recensioni dei clienti (10% della valutazione finale)
Oltre ai nostri test e valutazioni, consideriamo il net promoter score dei clienti attuali e passati. Esaminiamo la loro propensione, data la possibilità, a scegliere nuovamente lo strumento per le sue funzionalità di base. Un punteggio elevato riflette un alto net promoter score da clienti attuali o passati.
Rapporto qualità-prezzo (10% della valutazione finale)
Infine, considerando tutti gli altri criteri, valutiamo il prezzo medio dei piani base rispetto alle funzionalità fondamentali e teniamo in considerazione il valore degli altri criteri di valutazione. Il software che offre di più, a meno, ottiene punteggi più alti.
Core Features
Data Visualization
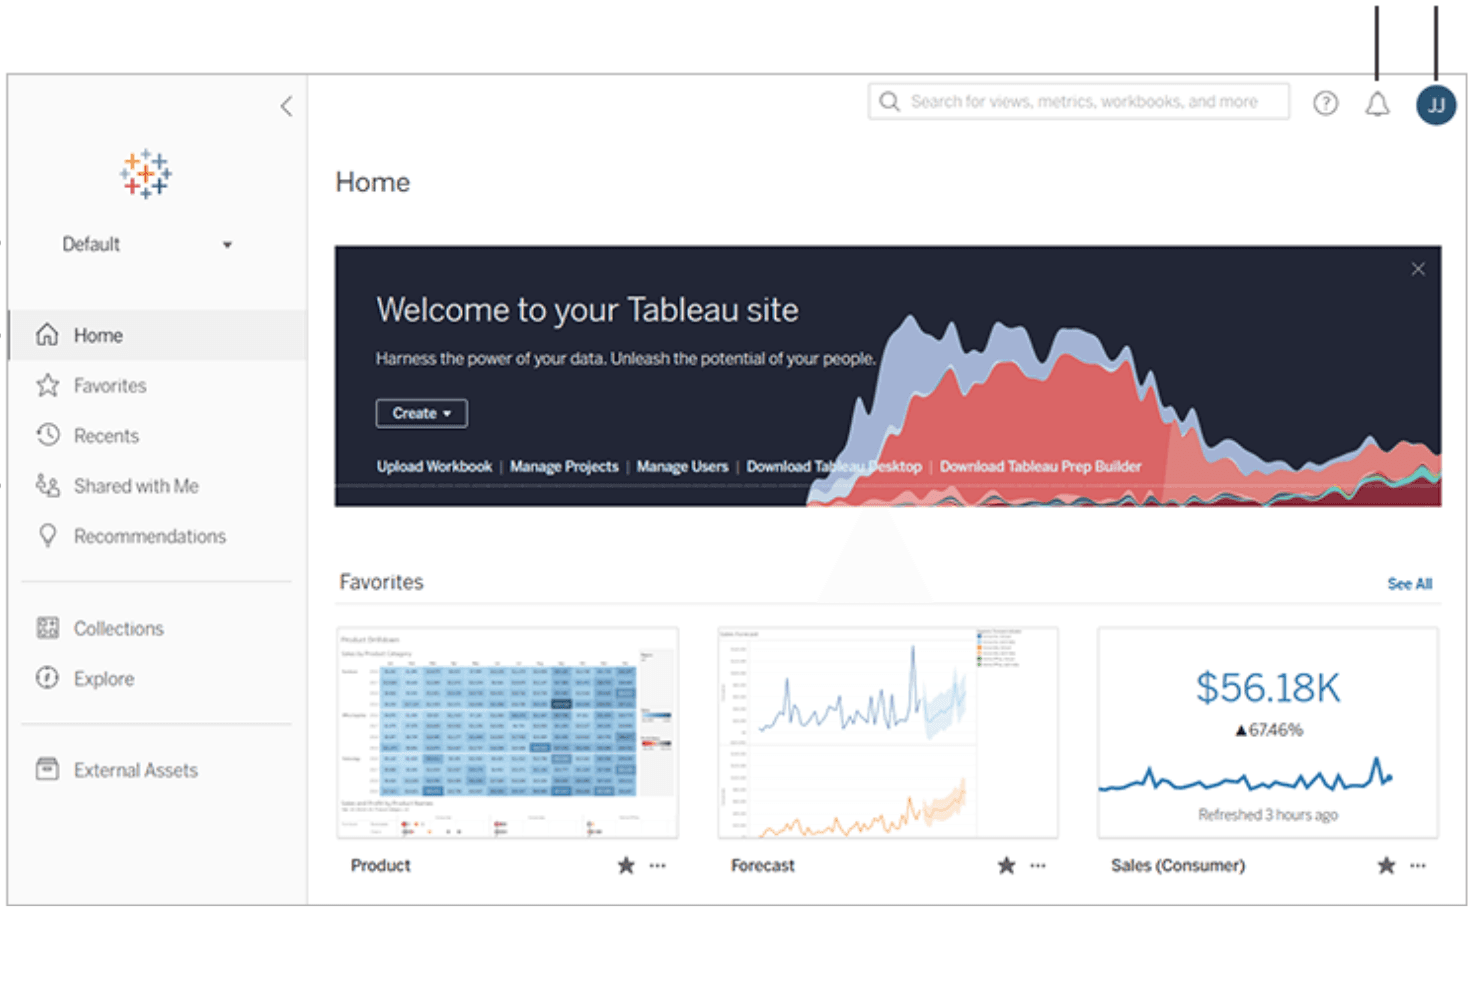
Tableau offers powerful tools for creating detailed visual reports, making complex data easy for your team to understand. You can drag and drop data to create graphs that highlight key insights.
Dashboard Creation
Build interactive dashboards that your team can customize to track KPIs, metrics, and trends. This feature allows you to see all your important metrics in one place.
Data Blending
Combine data from different sources to get a comprehensive view of your analytics. Your team can merge datasets and apply data modeling techniques to uncover deeper insights.
Real-Time Analytics
Tableau updates data in real-time, allowing your team to make informed decisions quickly. You won't miss out on current trends and metrics.
Collaboration Tools
Share insights and reports easily with your team to foster collaboration. Everyone stays on the same page with shared data visualizations.
Customizable Reports
Tailor reports to fit your team's specific needs and preferences. This flexibility helps you present data in a way that best serves your objectives.
Ease of Use
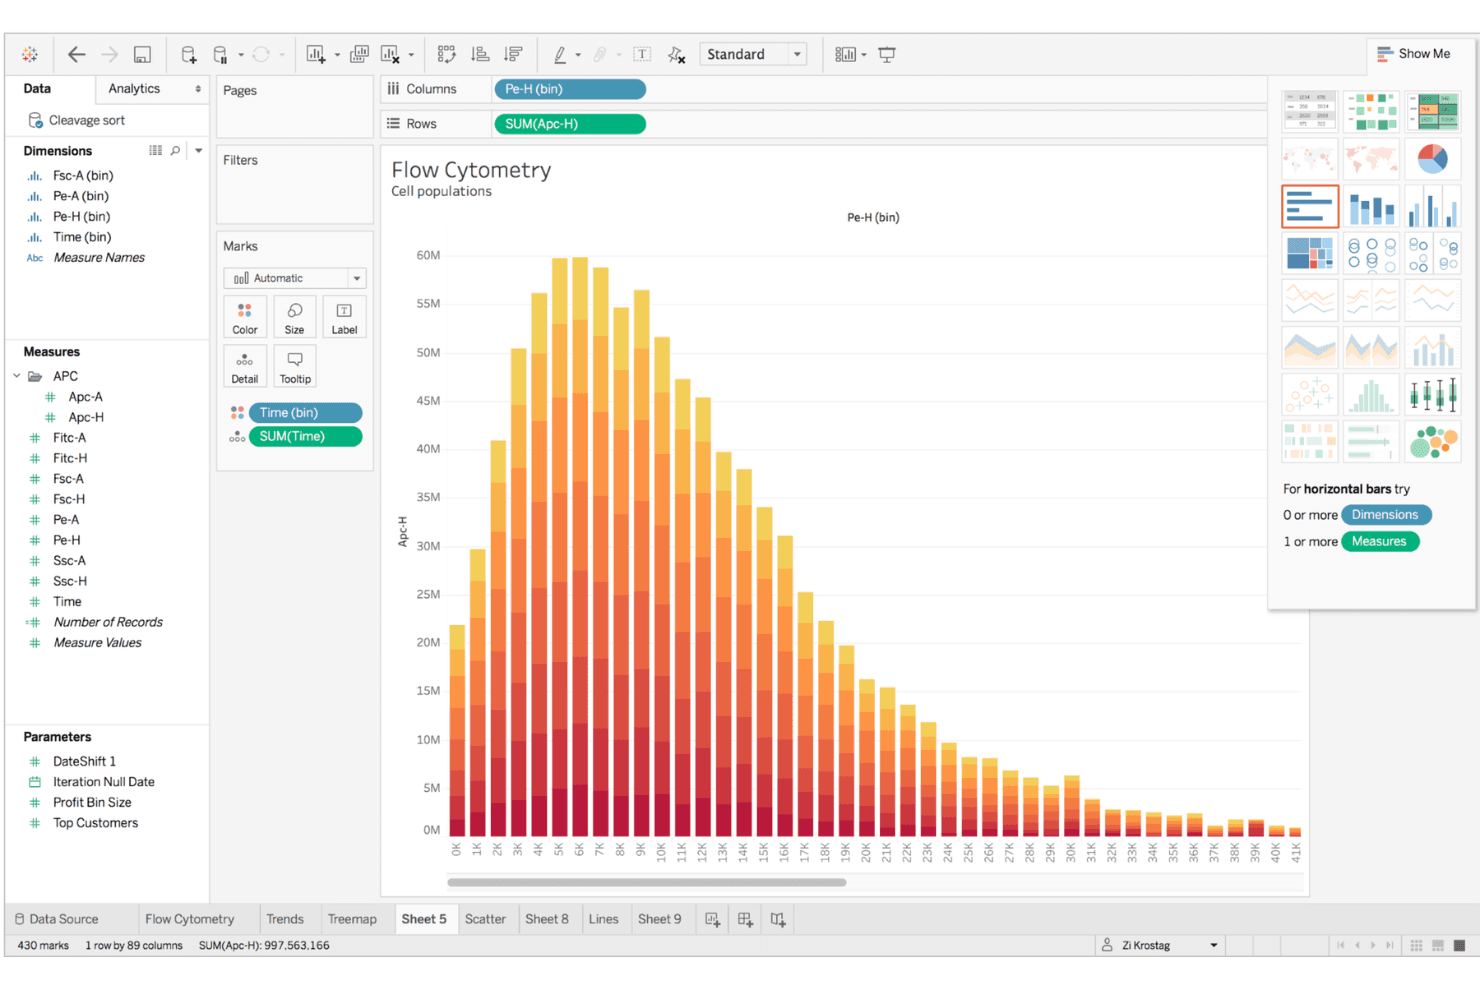
Tableau is generally user-friendly, with an intuitive interface that lets your team easily create visual reports and dashboards. Its drag-and-drop interface simplifies data visualization, making it accessible even for those with limited technical skills. However, some advanced features might have something of a steep learning curve, especially for non-technical users. Compared to other software, Tableau stands out for its ability to quickly turn data into actionable insights, which is valuable for your team's decision-making process.
Integrations
Tableau integrates with Azure Data Lake, Amazon S3, Google BigQuery, LinkedIn Sales Navigator, Salesforce CRM, Rollstack, dbt Semantic Layer, Ocient JDBC, MongoDB SQL, and Yellowbrick.
Tableau also offers an API for custom integrations and connects with third-party integration tools.
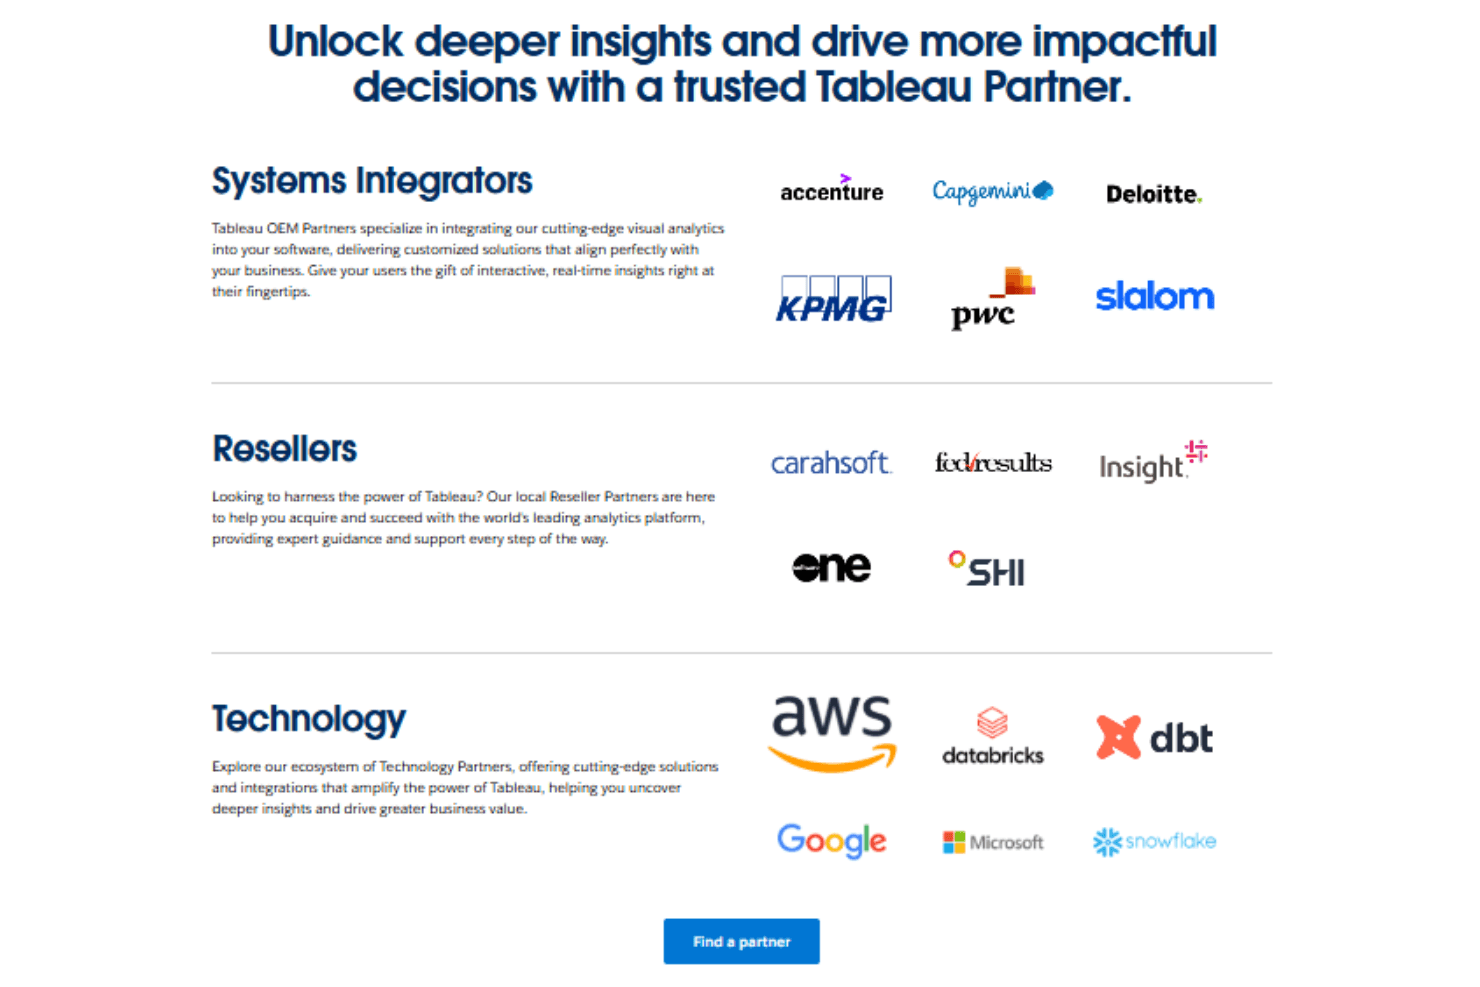
Tableau Specs
- A/B Testing: Yes
- Access Management: Yes
- Analytics: Yes
- API: Yes
- Conversion Tracking: Yes
- Custom Reports: Yes
- Customer Management: Yes
- Dashboards: Yes
- Data Export: Yes
- Data Import: Yes
- Data Mining: Yes
- Data Visualization: Yes
- External Integrations: Yes
- Forecasting: Yes
- Inventory Tracking: Yes
- Keyword Tracking: Yes
- Link Tracking: Yes
- Multi-User: Yes
- Notifications: Yes
- Project Management: Yes
- Reports: No
- Scenario Planning: Yes
- SEO: Yes
- Supplier Management: Yes
- Visualization: Yes


