

Reseña de Tableau: ventajas, desventajas, características y precios
Tableau sobresale en el análisis minorista al ofrecer una visualización de datos intuitiva que permite a tu equipo tomar decisiones informadas rápidamente.

Revisamos las herramientas de forma independiente y las comisiones ayudan a financiar nuestras pruebas. Consulta nuestra política de transparencia, nuestra metodología o sugiere una herramienta.
Tableau is a retail analytics software built around visual data exploration—letting retail teams analyze sales trends, monitor inventory, and surface channel performance through highly customizable dashboards. It's worth considering when your team needs more control over how data is visualized and explored than Microsoft Power BI typically allows, particularly if you're connecting multiple data sources and need reporting that can flex to match how your business actually operates.
Tableau Evaluation Summary
4.5/5
- Pricing upon request
- 14-day free trial
Por qué confiar en nuestras recomendaciones de software
6,700+
Reviews
20
Industry experts
16+
Evaluation factors
14
Years
Nuestro equipo lleva probando y evaluando software desde 2012. Como líderes del sector retail, sabemos lo difícil —y lo importante— que es elegir el software adecuado.
Para esta guía, evaluamos las herramientas mediante pruebas prácticas e investigación independiente, puntuando las herramientas según nuestros criterios de selección.
Nuestras reseñas reflejan nuestro criterio independiente, no un discurso de ventas.
Tableau Overview
In my opinion, Tableau is a strong choice for retail analytics, especially for teams needing powerful data visualization. Its intuitive interface and robust onboarding make it accessible, but its value may vary depending on your budget. Compared to competitors, Tableau excels in visualizing complex data but might not offer the best integration options for reducing tool usage. It's best suited for mid-sized to large retail operations that prioritize insightful visual reports over minimizing tool count. If your team values detailed data representation and can handle the occasional integration hiccup, Tableau is worth considering.
Pros
- Your team can create detailed visual reports with ease.
- It offers a user-friendly interface that simplifies data analysis.
- Onboarding is smooth, helping your team get up to speed quickly.
Cons
- Your team might find some advanced features require a learning curve.
- It can be resource-intensive, potentially slowing down older systems.
- Customer support response times may not always meet your expectations.
Is Tableau Right For Your Needs?
Who Would be a Good Fit for Tableau?
Tableau is ideal for retail managers, data analysts, and marketing teams who need to visualize data and gain insights quickly. If your work involves handling large datasets, Tableau's powerful visualization capabilities can simplify complex data into understandable visuals. Teams in industries like fashion and electronics, where detailed sales and customer analytics are crucial, will find Tableau's user-friendly interface and visual reporting beneficial. It's especially valuable for organizations that prioritize data-driven decisions and need to present complex insights clearly
- Fashion RetailYour team can benefit from Tableau's visual reports to track and analyze seasonal sales trends effectively.
- Electronics CompaniesTableau helps your team understand customer behavior and product performance with its detailed analytics.
- Data AnalystsIf your work involves large datasets, Tableau's visualization tools make complex data easy to interpret.
- Marketing TeamsYour team can use Tableau to create impactful visual reports that drive strategic marketing decisions.
- Mid-Sized BusinessesTableau's functionalities fit well with your need for comprehensive data analysis without overwhelming resources.
- Sales DepartmentsYour team can leverage Tableau's insights to optimize sales strategies and improve performance metrics.
Who Would be a Bad Fit for Tableau?
Tableau may not suit small businesses or startups with limited budgets and resources. If your team needs simple analytics without complex visualization, Tableau's advanced features might be overkill. Industries with minimal data analysis needs or those requiring seamless integration with various tools might find Tableau's setup cumbersome. Additionally, if your team lacks technical expertise, the learning curve for some features could be a barrier.
- Small BusinessesYour team might find Tableau's advanced features unnecessary and costly for basic analytics needs.
- StartupsIf your work involves limited data analysis, Tableau's capabilities may be more than you require.
- Non-Technical TeamsWithout technical expertise, your team might struggle with Tableau's more complex functionalities.
- Low Budget OperationsYour team might find Tableau's cost challenging if resources are tight.
- Simple Reporting NeedsIf your work only needs basic reports, Tableau's advanced visualization tools might be excessive.
- Tool-Heavy WorkflowsIf your team relies on multiple integrations, Tableau might not fit seamlessly into your current setup.
Nuestra Metodología de Revisión
Cómo Probamos y Puntamos Herramientas
Hemos pasado años construyendo, perfeccionando y mejorando nuestro sistema de pruebas y puntuación de software. La rúbrica está diseñada para captar los matices de la selección de software y lo que hace que una herramienta sea eficaz, enfocándose en los aspectos críticos del proceso de toma de decisiones. A continuación, puedes ver exactamente cómo funcionan nuestras pruebas y puntuaciones en siete criterios. Esto nos permite brindar una evaluación imparcial del software según la funcionalidad principal, características destacadas, facilidad de uso, incorporación, soporte al cliente, integraciones, reseñas de usuarios y relación calidad-precio.
Funcionalidad Principal (25% de la puntuación final)
El punto de partida de nuestra evaluación siempre es la funcionalidad principal de la herramienta. ¿Cuenta con las características y funciones básicas que un usuario esperaría ver? ¿Alguna de esas funcionalidades está limitada a planes de precios superiores? En esencia, esperamos que una herramienta se compare favorablemente con las capacidades básicas de sus competidores.
Características Destacadas (25% de la puntuación final)
A continuación, evaluamos las características sobresalientes poco comunes que van más allá de la funcionalidad principal que normalmente se encuentra en herramientas similares. Una alta puntuación refleja funcionalidades especializadas o únicas que hacen que el producto sea más rápido, eficiente o aporte un valor extra al usuario. También evaluamos qué tan fácil es integrar la herramienta con otras comúnmente usadas en el entorno tecnológico para ampliar la funcionalidad y utilidad del software. Las herramientas que ofrecen numerosas integraciones nativas, conexiones de terceros y acceso a API para crear integraciones personalizadas obtienen la mejor puntuación.
Facilidad de Uso (10% de la puntuación final)
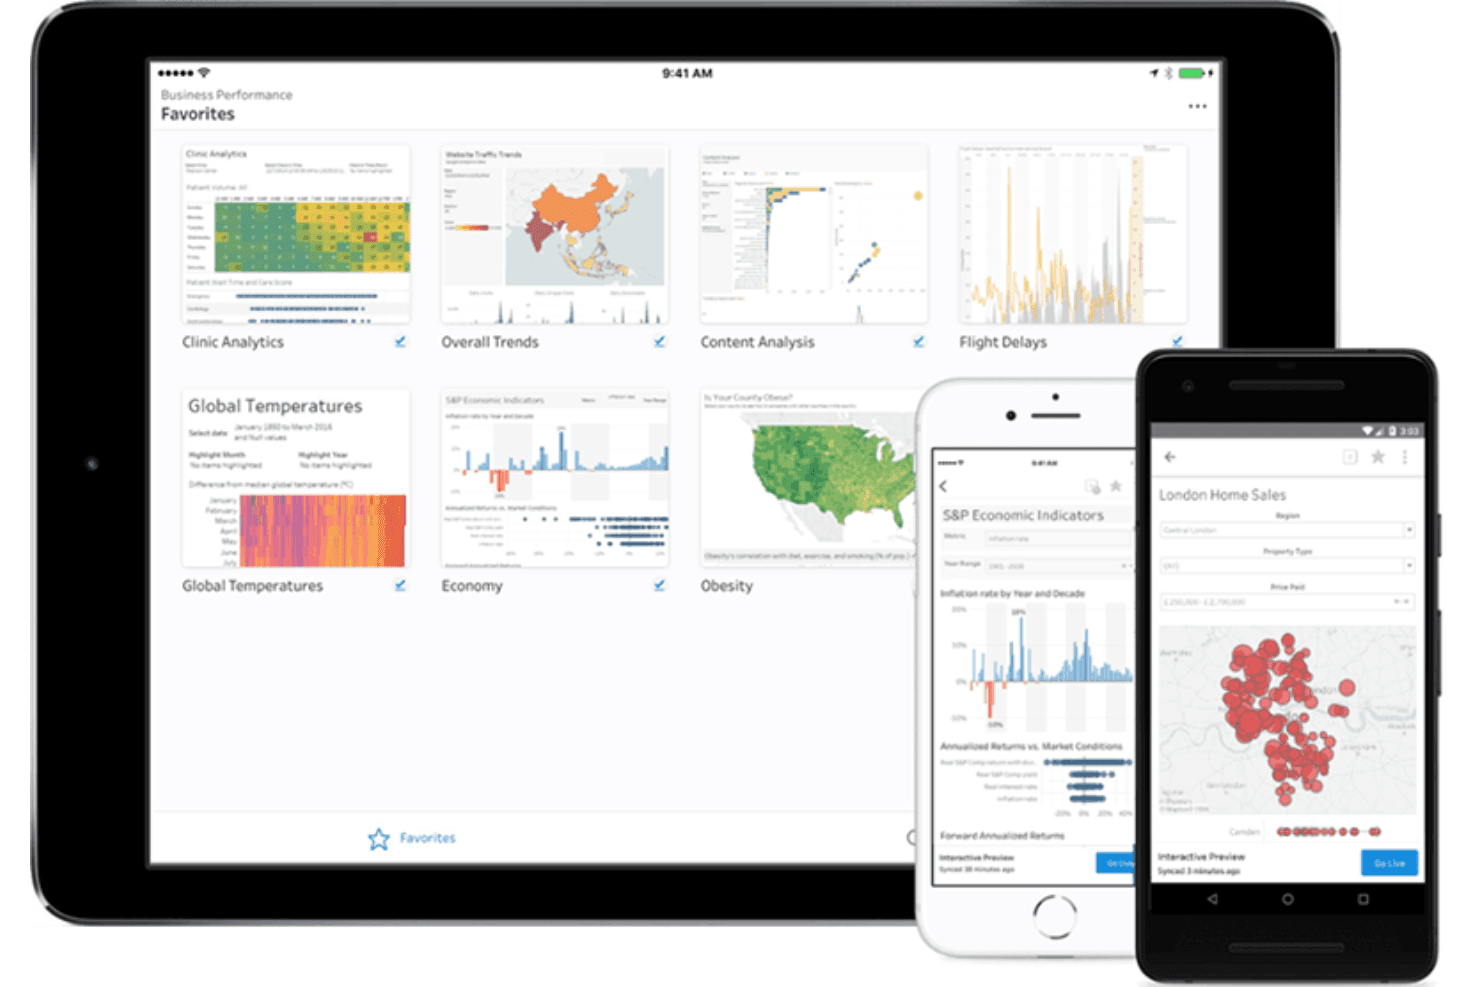
Consideramos qué tan rápido y fácil es realizar las tareas definidas en la funcionalidad principal usando la herramienta. El software de alta puntuación está bien diseñado, es intuitivo, ofrece aplicaciones móviles, proporciona plantillas y hace que tareas relativamente complejas parezcan simples.
Incorporación (10% de la puntuación final)
Sabemos lo importante que es que un equipo adopte rápidamente una nueva plataforma, así que evaluamos qué tan fácil es aprender y usar la herramienta con mínima capacitación. Analizamos cuánto tiempo tarda un miembro del equipo en prepararse y comenzar a usar la herramienta sin experiencia previa. Las soluciones con alta puntuación requieren poco o ningún soporte.
Soporte al Cliente (10% de la puntuación final)
Revisamos qué tan rápido y fácil es obtener ayuda por teléfono, chat en vivo o base de conocimientos. Las herramientas y empresas que ofrecen soporte en tiempo real obtienen la mejor puntuación, mientras que los chatbots obtienen la peor.
Reseñas de Clientes (10% de la puntuación final)
Además de nuestras pruebas y evaluaciones, consideramos el puntaje neto de promotores de clientes actuales y pasados. Revisamos la probabilidad de que elijan de nuevo la herramienta para la funcionalidad principal. Un software con alta puntuación refleja un alto NPS de clientes actuales o pasados.
Relación Calidad-Precio (10% de la puntuación final)
Por último, considerando todos los demás criterios, revisamos el precio promedio de los planes de nivel básico frente a las características principales y consideramos el valor de los otros criterios de evaluación. El software que ofrece más por menos, tendrá una puntuación más alta.
Core Features
Data Visualization
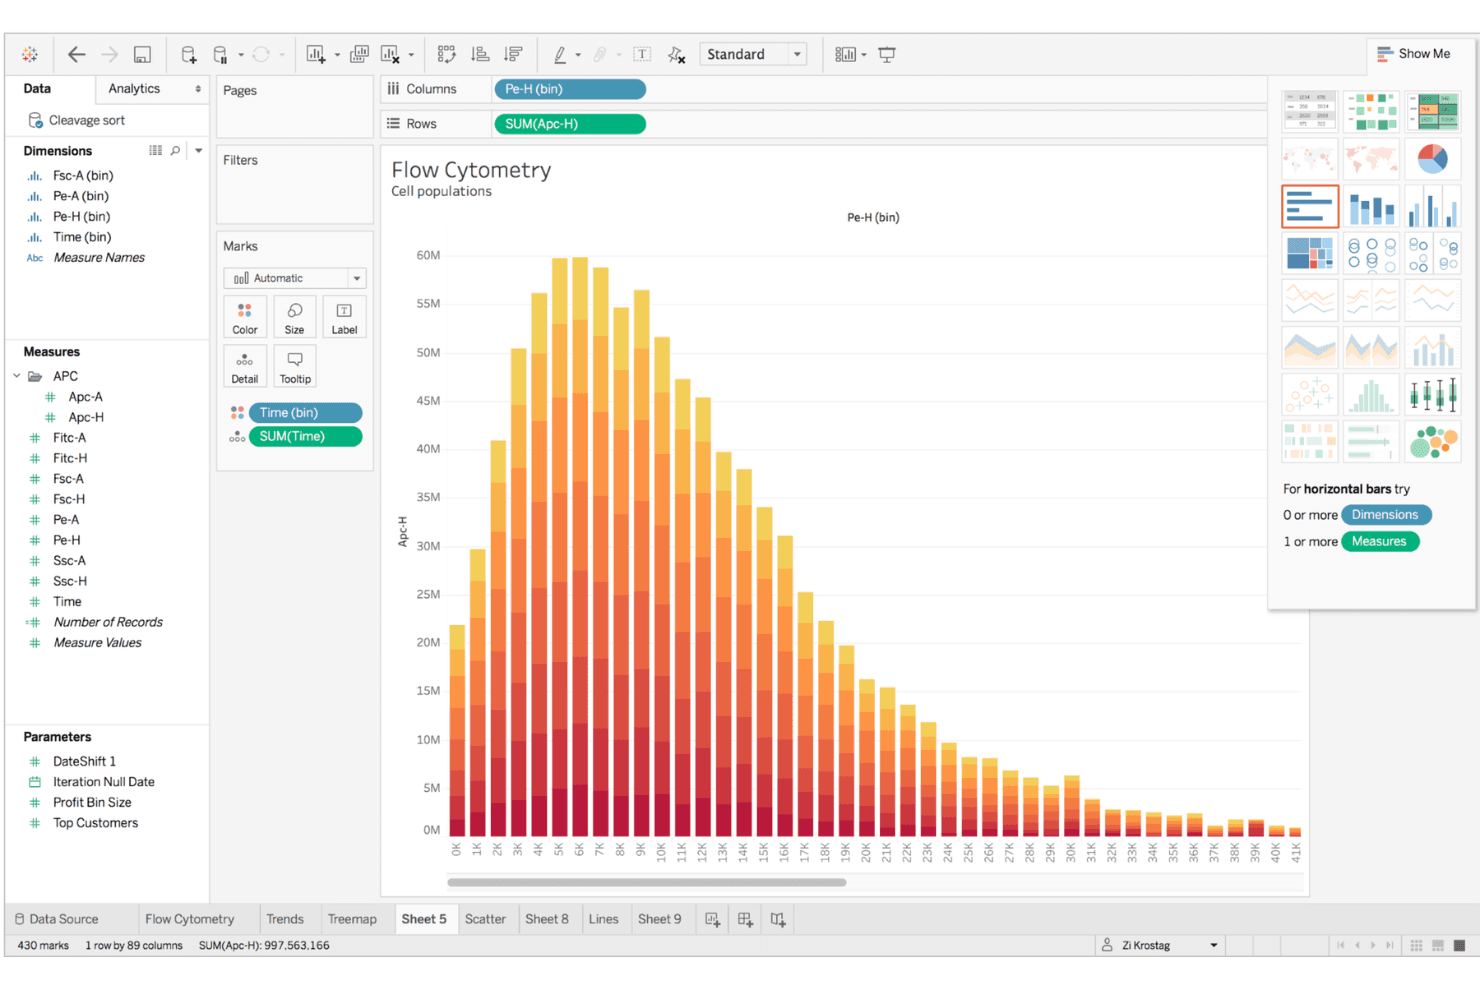
Tableau offers powerful tools for creating detailed visual reports, making complex data easy for your team to understand. You can drag and drop data to create graphs that highlight key insights.
Dashboard Creation
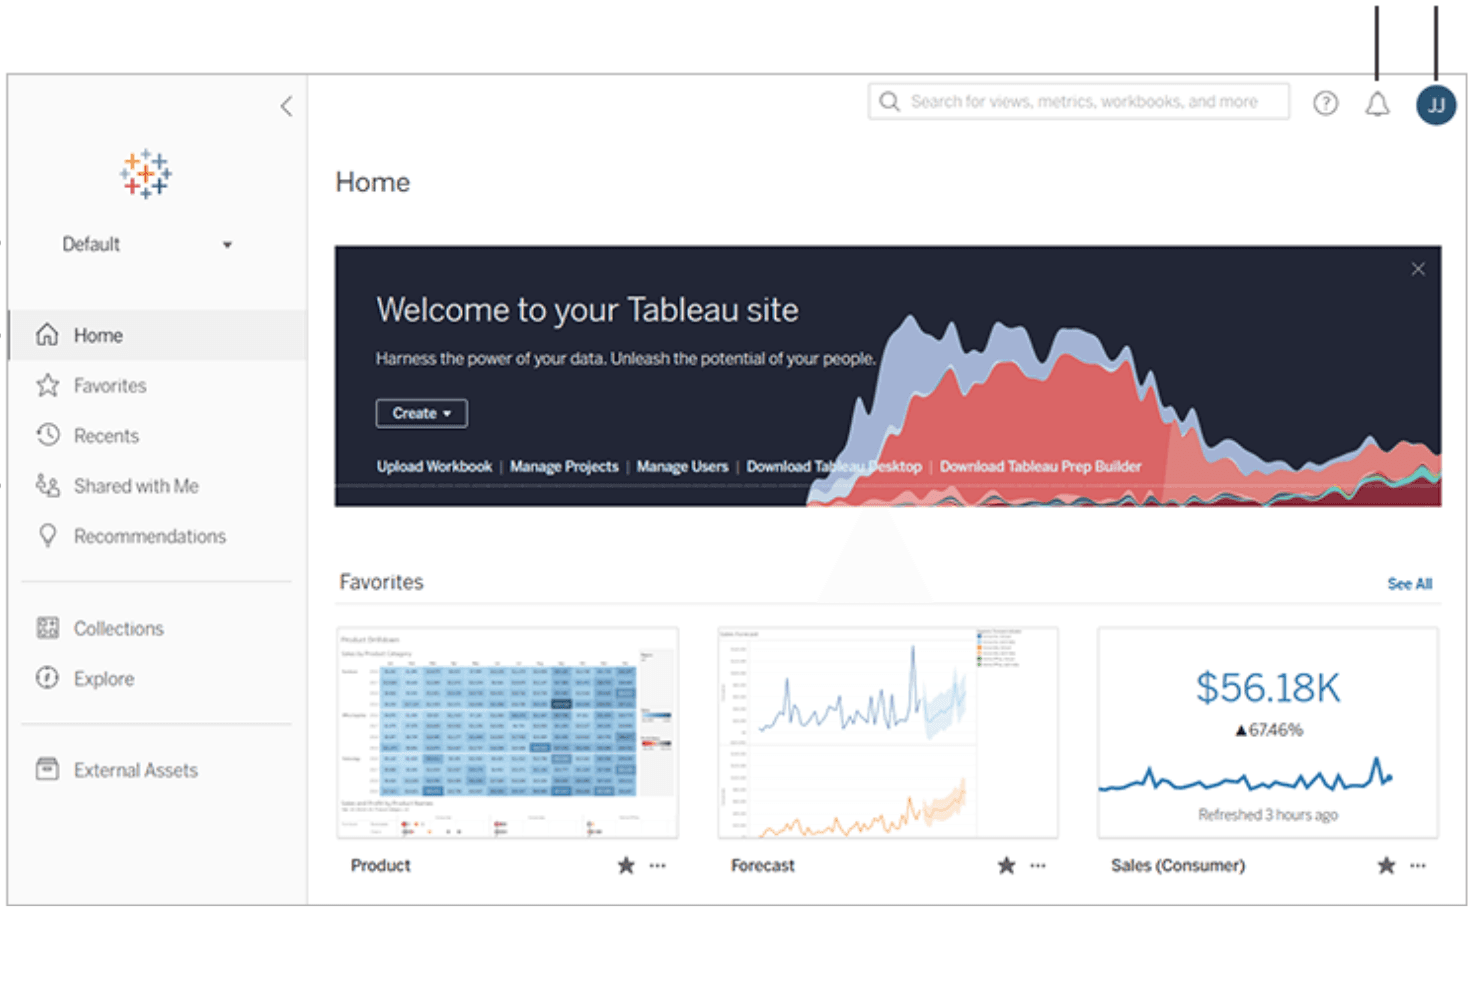
Build interactive dashboards that your team can customize to track KPIs, metrics, and trends. This feature allows you to see all your important metrics in one place.
Data Blending
Combine data from different sources to get a comprehensive view of your analytics. Your team can merge datasets and apply data modeling techniques to uncover deeper insights.
Real-Time Analytics
Tableau updates data in real-time, allowing your team to make informed decisions quickly. You won't miss out on current trends and metrics.
Collaboration Tools
Share insights and reports easily with your team to foster collaboration. Everyone stays on the same page with shared data visualizations.
Customizable Reports
Tailor reports to fit your team's specific needs and preferences. This flexibility helps you present data in a way that best serves your objectives.
Ease of Use
Tableau is generally user-friendly, with an intuitive interface that lets your team easily create visual reports and dashboards. Its drag-and-drop interface simplifies data visualization, making it accessible even for those with limited technical skills. However, some advanced features might have something of a steep learning curve, especially for non-technical users. Compared to other software, Tableau stands out for its ability to quickly turn data into actionable insights, which is valuable for your team's decision-making process.
Integrations
Tableau integrates with Azure Data Lake, Amazon S3, Google BigQuery, LinkedIn Sales Navigator, Salesforce CRM, Rollstack, dbt Semantic Layer, Ocient JDBC, MongoDB SQL, and Yellowbrick.
Tableau also offers an API for custom integrations and connects with third-party integration tools.
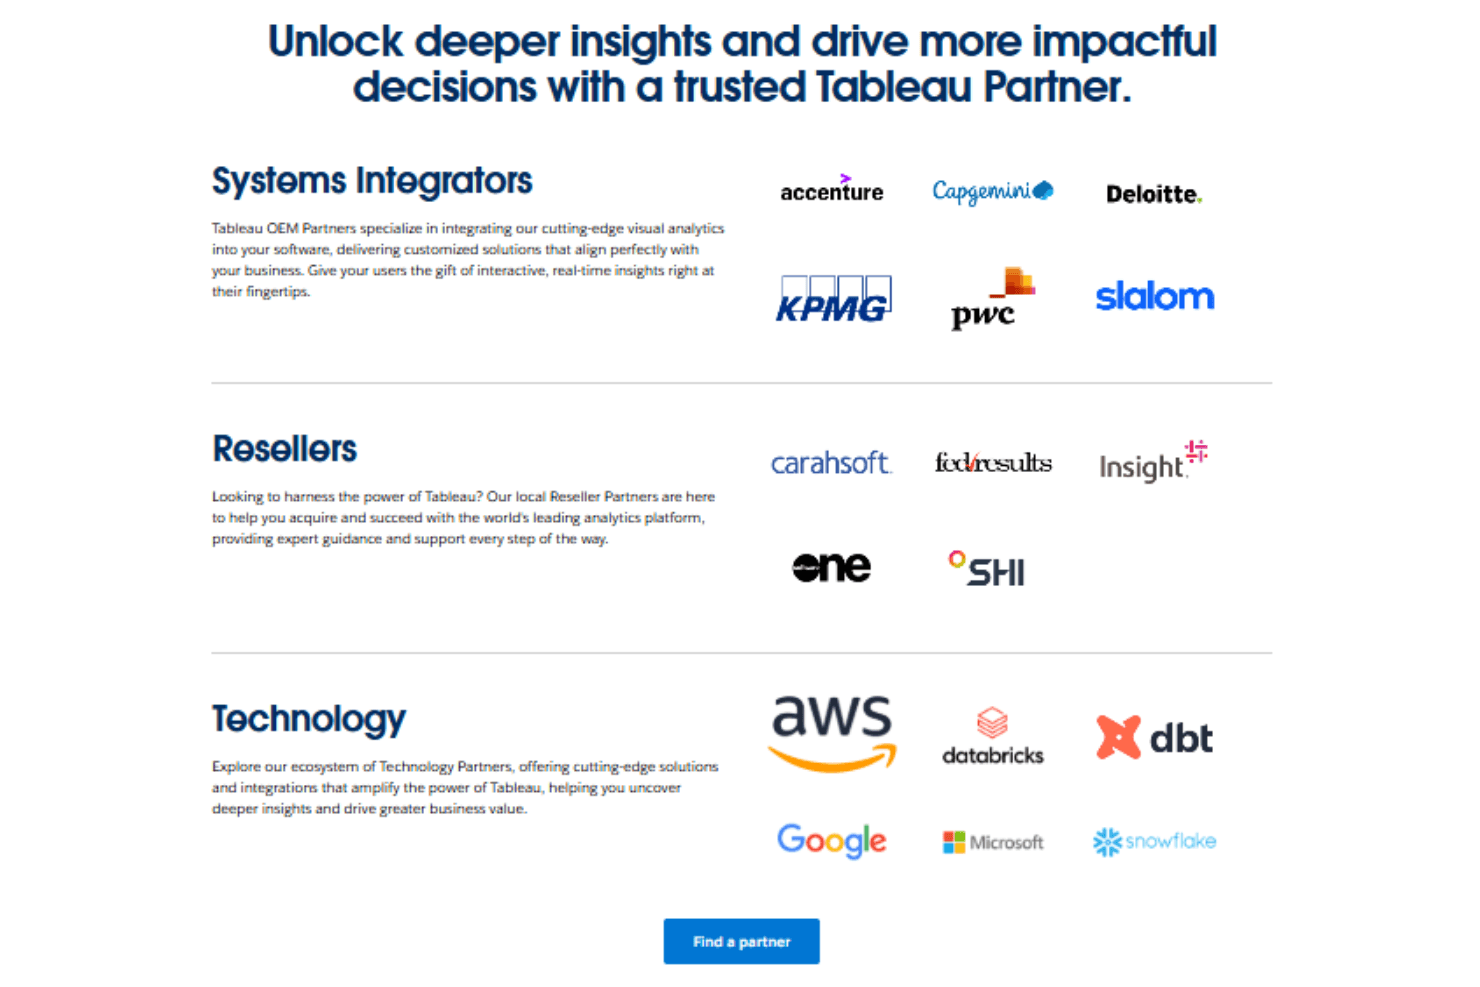
Tableau Specs
- A/B Testing: Yes
- Access Management: Yes
- Analytics: Yes
- API: Yes
- Conversion Tracking: Yes
- Custom Reports: Yes
- Customer Management: Yes
- Dashboards: Yes
- Data Export: Yes
- Data Import: Yes
- Data Mining: Yes
- Data Visualization: Yes
- External Integrations: Yes
- Forecasting: Yes
- Inventory Tracking: Yes
- Keyword Tracking: Yes
- Link Tracking: Yes
- Multi-User: Yes
- Notifications: Yes
- Project Management: Yes
- Reports: No
- Scenario Planning: Yes
- SEO: Yes
- Supplier Management: Yes
- Visualization: Yes


